IMAGE

Figure 4.

ID
ZDB-IMAGE-210911-43
Source
Figures for Partoens et al., 2021
Image
Figure Caption

Figure 4.

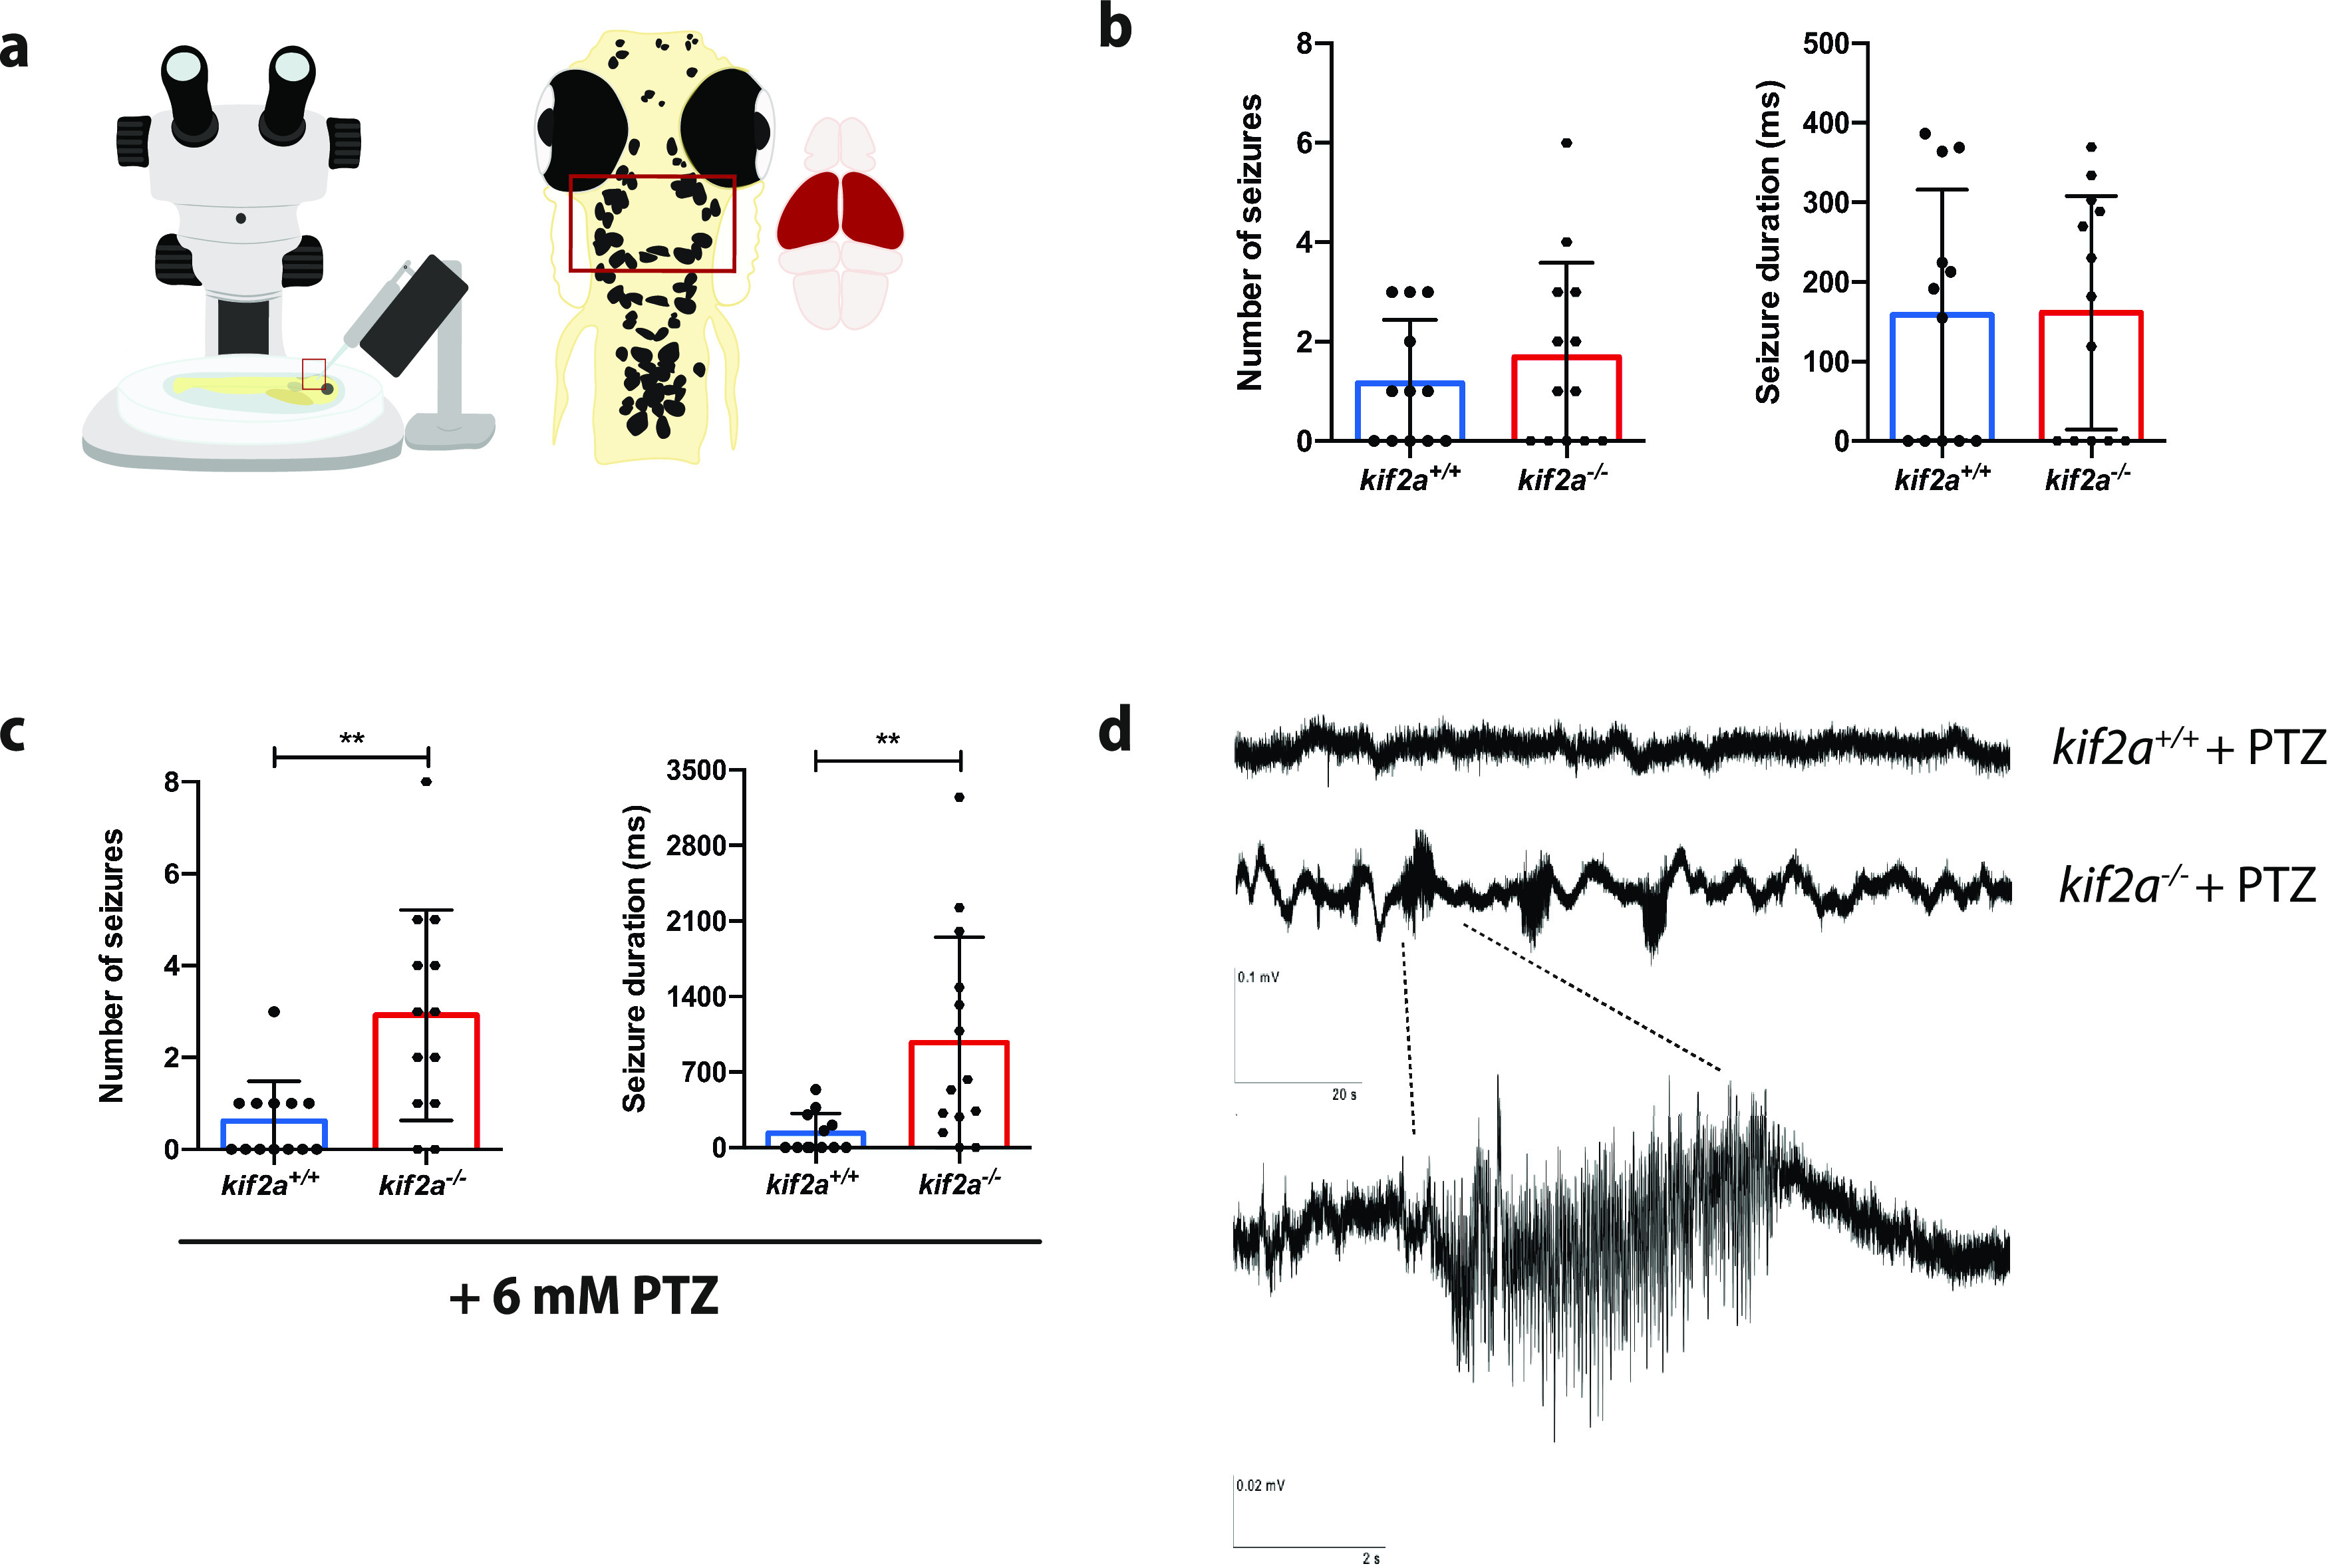
kif2a−/− larvae show increased susceptibility to epilepsy. a, Visual representation of the setup of local field potential recording from optic tectum (indicated in red) of 5 dpf larvae. b, Number of seizures and average seizure duration in kif2a+/+ and kif2a−/− larvae. c, Number of seizures and average seizure duration in kif2a+/+ and kif2a−/− larvae after 6 mm PTZ immersion for 15 min. d, Representative fragments of a 10 min recording (calibration: 0.1 mV, 20 s) of kif2a+/+ and kif2a−/− larvae after 6 mm PTZ immersion for 15 min, with enlargement of a polyspiking event (calibration: 0.02 mV, 2 s) in kif2a−/− larvae. Data are represented as the mean ± SD. Significant values are noted as **p ≤ 0.01. No increased seizure susceptibility was observed in the brains of kif2a−/− zebrafish larvae from +/– incrosses (Extended Data Fig. 4-1).

Figure Data
Acknowledgments
This image is the copyrighted work of the attributed author or publisher, and ZFIN has permission only to display this image to its users. Additional permissions should be obtained from the applicable author or publisher of the image. Full text @ eNeuro