
|
Figure 6
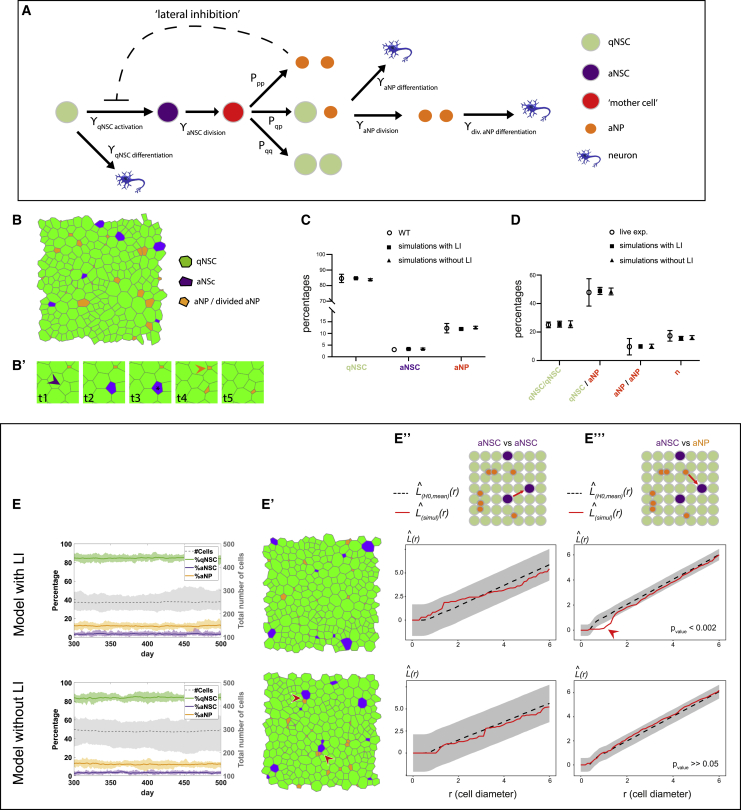
An NSC lattice model captures NSC population dynamics
(A) Model lineage flowchart. γ: transition rates; Pqq, Pqp, and Ppp: probabilities for (as)symmetric aNSC divisions; dashed line: lateral inhibition (LI) of aNPs on NSC activation (see also
(B and B’) Snapshot of the lattice (B) and (B’) examples of activation (purple arrowhead), division (black star), and differentiation (orange arrowhead) (
(C and D) Average cell proportions (C) and (D) percentages of cell fates following cell division in sets of 18 simulations with and without LI versus
(E–E’’’) Dynamics and spatial correlations from the NSC lattice model with (top) and without (bottom) aNP-driven LI.
(E) Stable cell numbers and proportions over time, matching experimental data. Bold line: mean; shaded area: range; n = 18 simulations..
(E’) Snapshots of the lattice at 1 time step from a simulation of 500 time steps. Red arrowheads: aNSCs neighboring aNPs.
(E’’ and E’’’) Besag’s