|
Figure 4
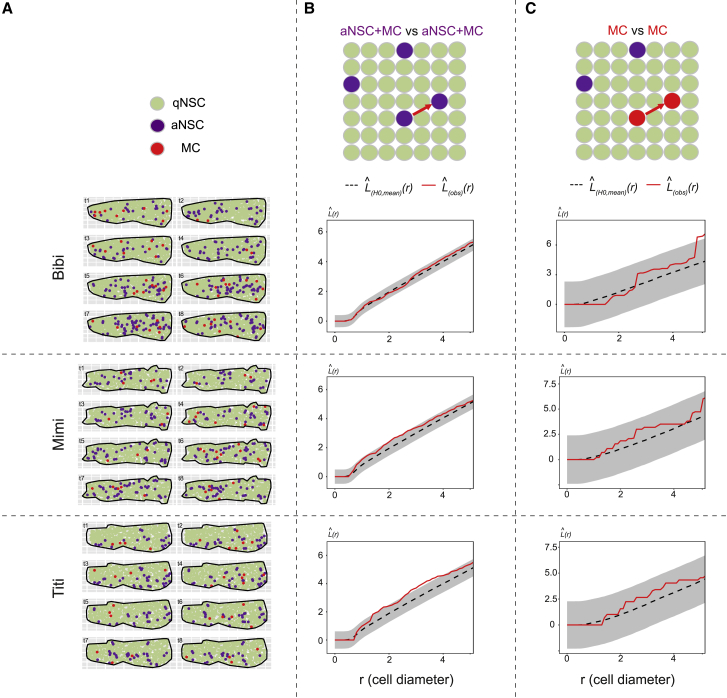
Static spatial analysis of NSC activation from dynamic datasets
(A) Dm surfaces segmented for the 3 fish analyzed (Bibi, Mimi, Titi) at all time points, cell states color-coded (see also
(B and C)

|
|
Figure 4
Static spatial analysis of NSC activation from dynamic datasets
(A) Dm surfaces segmented for the 3 fish analyzed (Bibi, Mimi, Titi) at all time points, cell states color-coded (see also
(B and C)