
|
Figure 2
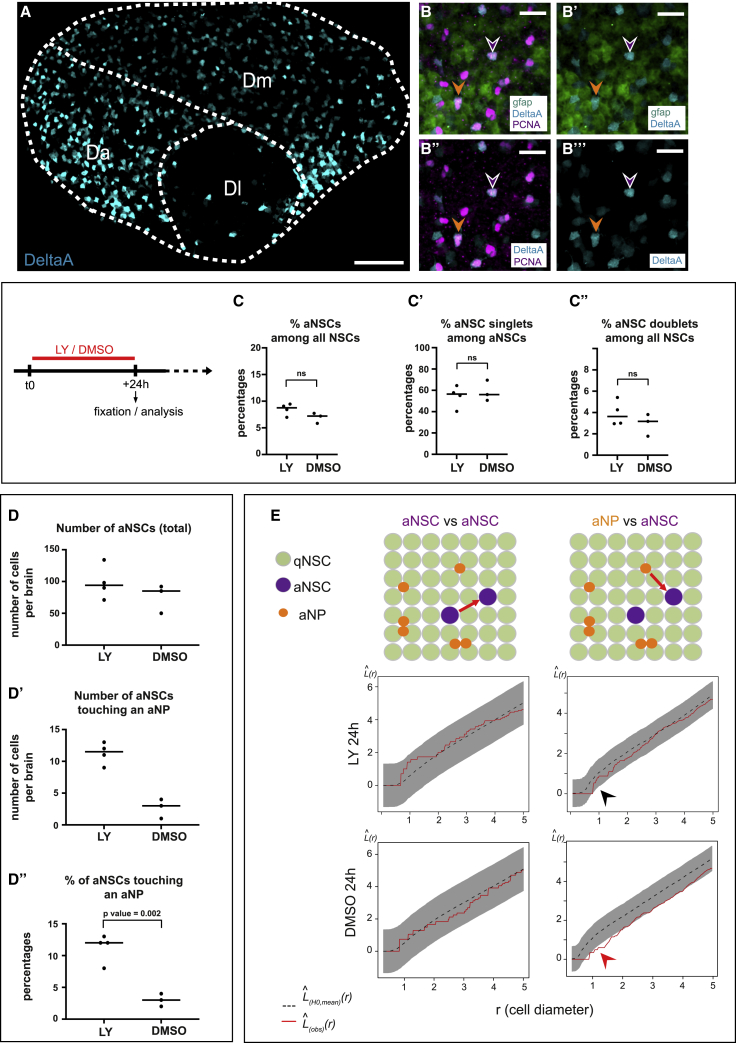
The lower incidence of activated NSCs close to aNPs is Notch signaling dependent
(A) Confocal whole-mount view of the pallial germinal layer in a 3mpf
(B–B’’’) Close-ups in Dm, all channels. Arrowheads: magenta, aNSC; orange, aNP; expressing
(C–C’’) Percentages of aNSCs (all, pre-, or post-division) among all NSCs (C and C”) or aNSCs (C’) upon 24-h LY treatment (DMSO: control). ns, non-significant; unpaired t test (see also
(D–D”) Number (D and D’) and proportion (D’’) of aNSCs, in total (D) or touching aNPs upon 24-h LY treatment (DMSO: control) (D’’, p = 0.002, t test) (see also
(E) Spatial distribution (Besag’s
Scale: (A) 40 μm, (B)–(B’’’) 20 μm.