
|
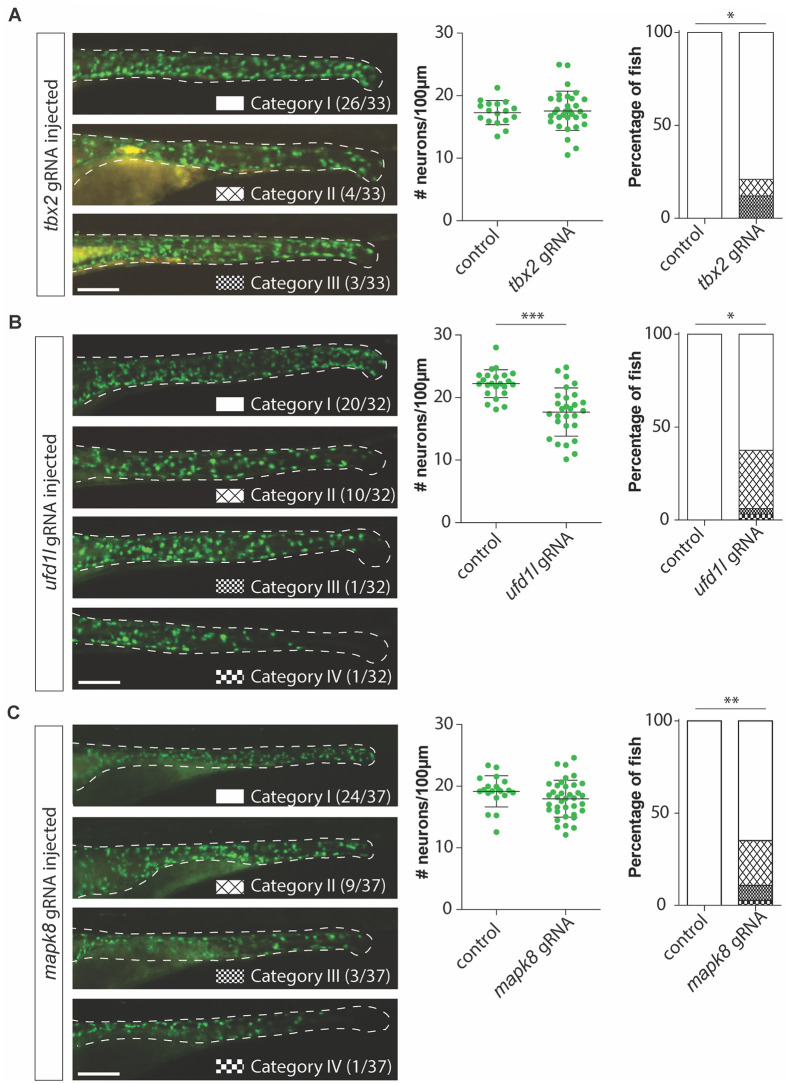
Fig 4
(A) Figures and graphs showing that disruption of tbx2a/b in zebrafish does not result in overall significantly reduced numbers of phox2bb-GFP+ cells, however it does induce ENS phenotypes in category II and III in a significant number of zebrafish larvae. (B) Figures and graphs showing that disruption of ufd1l in zebrafish results in significantly reduced numbers of phox2bb-GFP+ cells and increase in the percentage of fish presenting with an ENS phenotype. (C) Figures and graphs showing that disruption of mapk8a/b in zebrafish does not result in overall significantly reduced numbers of phox2bb-GFP+ cells, however it does induce ENS phenotypes in a significant number of zebrafish larvae. Statistical tests used: students t-test and "N-1" Chi-squared test; * p < 0.05 ** p < 0.01 *** p < 0.001; Exact p-values and statistics can be found in