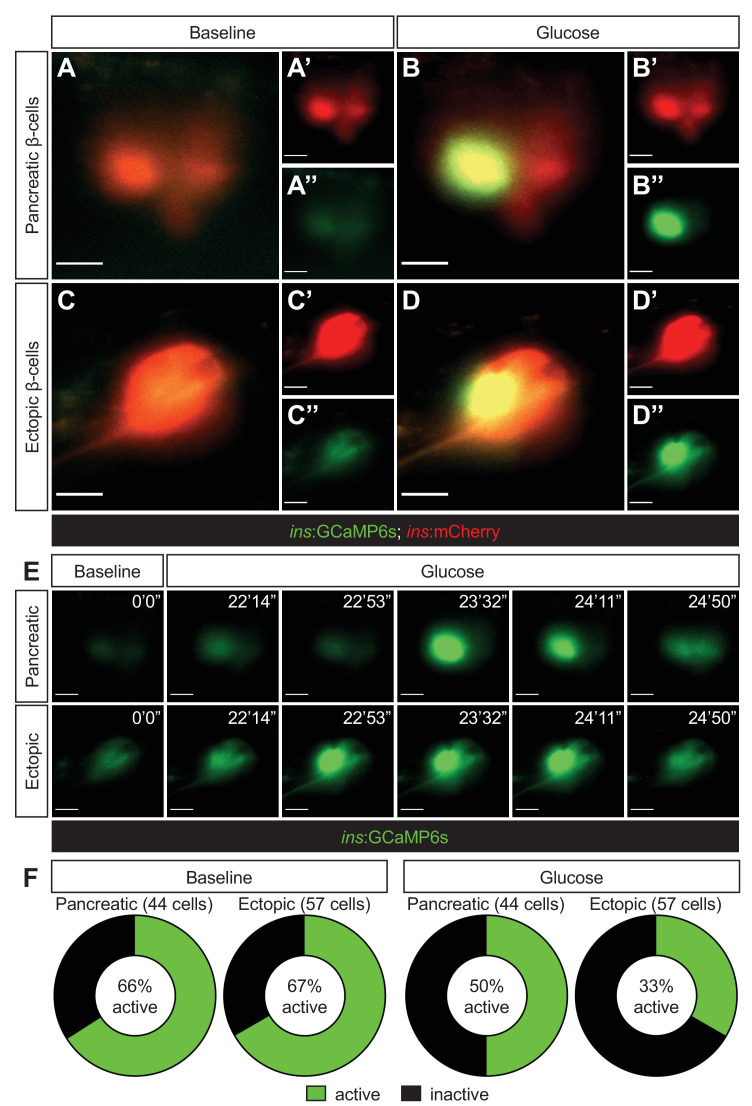
Figure 3.
Representative images captured from a live calcium imaging video of npas4l?/?Tg(ins:GCaMP6s);Tg(ins:mCherry);Tg(ins:Flag-NTR) zebrafish larvae at 3 dpf after ?-cell ablation by MTZ from 1 to 2 dpf, showing ?-cells expressing ins:mCherry in red and displaying calcium activity in green in the pancreatic (A, B) or ectopic (C, D) domain at the baseline (A, C) or after the addition of 200 mM of glucose to the E3 medium (B, D). (E) Sequential images captured from a live calcium imaging video to show the oscillation of calcium signalling at the baseline and after the glucose treatment, displaying the GCaMP6s signal in green. (F) Quantification of pancreatic or ectopic ?-cells displaying calcium activity at the baseline or after glucose treatment in 11 (pancreatic) or 17 (ectopic) npas4l zebrafish mutants. Scale bars = 10 ?m.
Ectopic ?-cells can respond to glucose by displaying calcium oscillations.
Image
Figure Caption
Acknowledgments
This image is the copyrighted work of the attributed author or publisher, and
ZFIN has permission only to display this image to its users.
Additional permissions should be obtained from the applicable author or publisher of the image.
Full text @ Elife

