
|
Fig. EV5
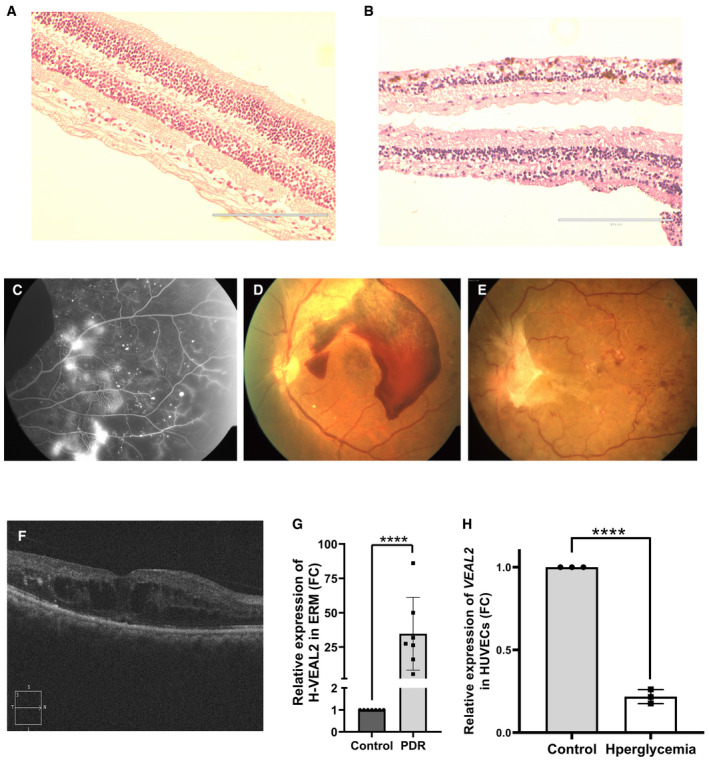
H&E‐based immunohistochemistry of retina indicating symptoms of diabetic retinopathy (DR). (A) Retina of control sample indicating regular retinal structures with proper cellular organization. (B) Retina samples of DM patients highlighted early symptoms of retinopathy in form of degeneration of ganglion layer, microaneurysm, arteriolar dilatation, and mild edema. Scale bar is 200 μm. Retina scan of patients highlighting symptoms of retinopathy. (C) Fundus fluorescence angiography of patients showing vessel integrity defects. (D) Fundus photograph of a patient with symptoms of proliferative diabetic retinopathy and having subhyaloid hemorrhages. (E) Fundus photograph of a patient with symptoms of proliferative diabetic retinopathy with fibrovascular proliferation at disk and abnormal new blood vessels (NVE). (F) Optical coherence tomography of patients with diabetic macular edema. Dot plot representing relative expression of Bar graph representing relative expression of
Data information: All the experiments