Image
Figure Caption
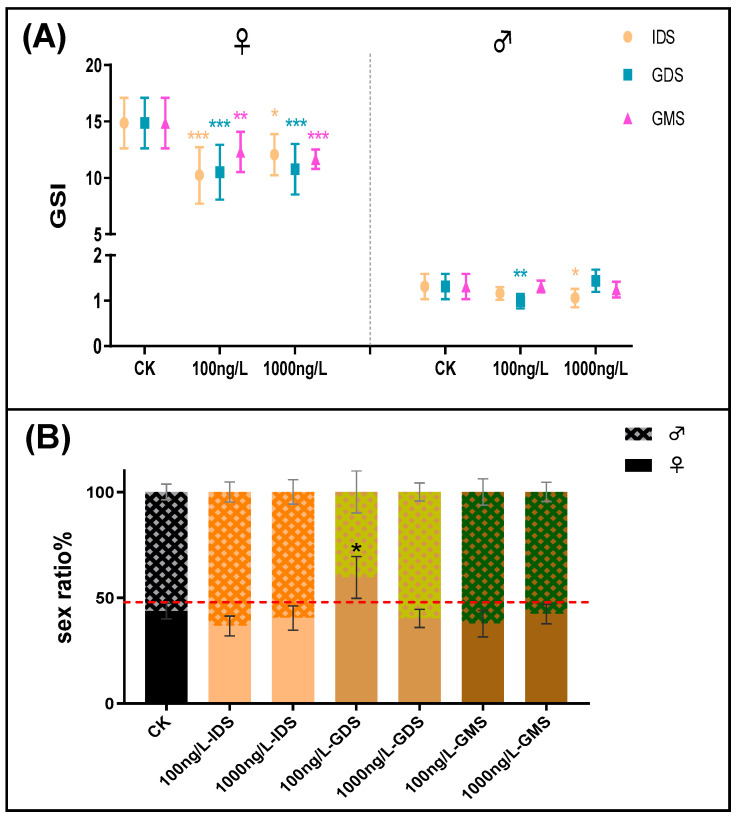
Figure 2 (A) Gonadosomatic index (GSI) of zebrafish at 90 dpf for every group. (n = 15 fish per replicate at 90 dpf). (B) Sex ratio of zebrafish at 90 dpf for every group. (n = 6 fish per replicate at 90 dpf). Values are shown as mean ± SD (n = 3 replicates per treatment). Asterisks denote significant differences between control and treatments (* p < 0.05, ** p < 0.01, and *** p < 0.005, according to Dunnett?s multiple comparisons test). CK-control group.
Figure Data
Acknowledgments
This image is the copyrighted work of the attributed author or publisher, and
ZFIN has permission only to display this image to its users.
Additional permissions should be obtained from the applicable author or publisher of the image.
Full text @ Biomolecules

