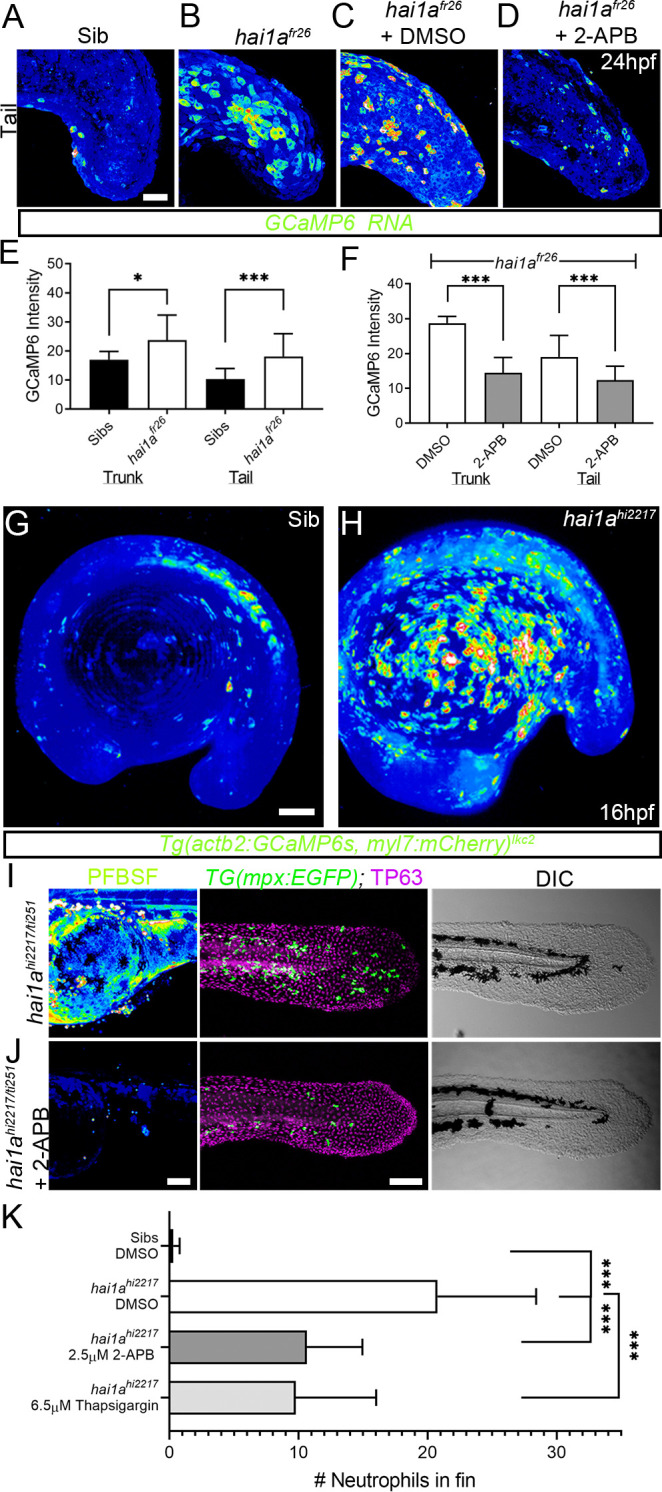
Figure 3 (A?D) Projected confocal images of eGFP in the tail of WT (A) or hai1afr26; (B?D) injected with GCaMP6s RNA, imaged at 24hpf, indicating calcium dynamics. Embryos are either untreated (A, B), treated with DMSO (C), or with 2.5 然 2-APB (D). Images are temporal projections of timelapse movies taken at maximum speed intervals (2 min) and projected by time. (E, F) Graphs comparing eGFP intensities from GCaMP6s RNA timelapses in trunk and tail between 24hpf WT and hai1afr26 (E) and between hai1afr26 treated with DMSO and 2.5 然 2-APB (F). n = 10; t-test; *p<0.05, ***p<0.001. (G, H) Projected light-sheet images of Tg(actb2:GCaMP6s, myl7:mCherry)lkc2 embryos indicating calcium dynamics at 16hpf of sibling (G) or hai1ahi2217 (H). Images are temporal projections of timelapse movies taken at 45 s intervals and projected by time. (I, J) Pentafluorobenzenesulfonyl fluorescein (PFBSF) staining at 24hpf (left column), TP63 (magenta), and eGFP (green) antibody staining at 48hpf (middle column) with DIC imaging (right column) for hai1ahi2217/ti251 mutants (J), or hai1ahi2217/ti247 mutants treated with 2.5 然 2-APB (I). Individuals for middle and right columns were hemizygous for the Tg(mpx:eGFP)i114 transgene. (K) Counts of eGFP-positive neutrophils in the fins at 48hpf of Tg(mpx:eGFP)i114, or hai1ahi2217; Tg(mpx:eGFP)i114 treated with 0.5% DMSO, 2.5 然 2-APB, or 6.5 然 thapsigargin. n = 20; t-test; ***p<0.001. Scale bars (A?D) = 50 痠; (G, I, J) = 100 痠.
Image
Figure Caption
Acknowledgments
This image is the copyrighted work of the attributed author or publisher, and
ZFIN has permission only to display this image to its users.
Additional permissions should be obtained from the applicable author or publisher of the image.
Full text @ Elife

