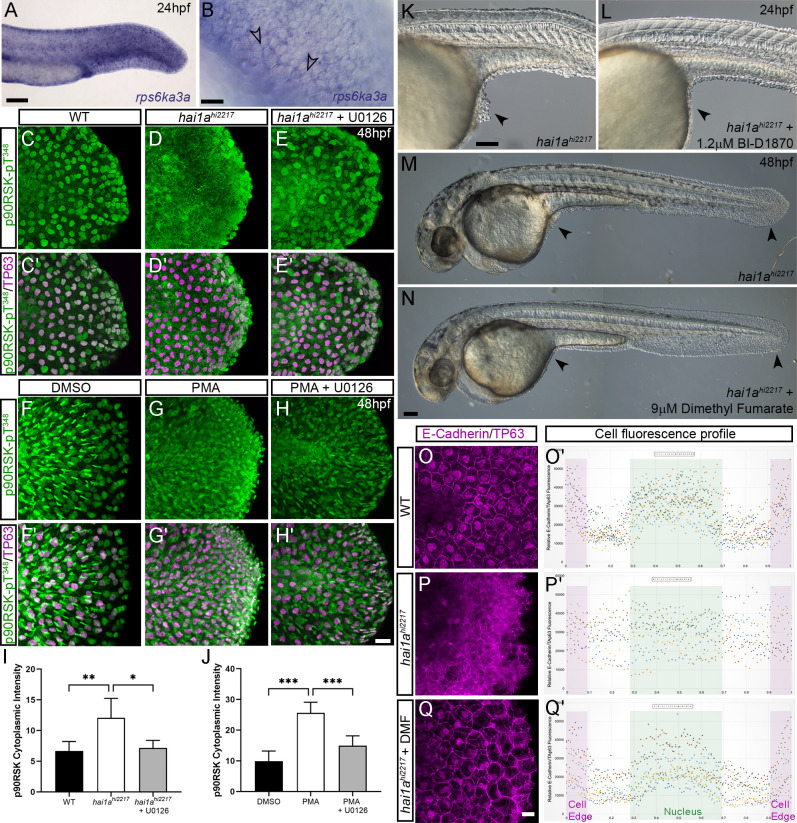
Figure 10 (A, B) In situ hybridisation of rps6ka3a at 24hpf under low- (A) and high-power (B) magnification showing expression in basal keratinocytes. Open arrowheads in (B) indicate borders of EVL cells bisecting nuclei of underlying rps6ka3a-positive cells. (C?H?) Lateral projected confocal images of the tails of embryos immunostained for p90RSK (Phospho-Thr348) (C?H?) and TP63 (C??H?). In both the hai1ahi2217 (D, D?) and 125 ng/ml phorbol 12-myristate 13-acetate (PMA)-treated (G, G?) embryos, there is an increase in cytoplasmic levels of p90RSK (Phospho-Thr348) signal above the nuclear only signal seen in WT (C, C?) or DMSO (F, F?). Treatment with the pERK inhibitor U0126 reduced cytoplasmic levels but did not affect nuclear signal (E, E?; H, H?), (I, J) Quantification of immunofluorescent intensity of cytoplasmic levels of p90RSK (Phospho-Thr348) in basal keratinocytes of tails of 48hpf WT and hai1ahi2217, treated with DMSO or U0126 (I), and PMA or PMA plus U0126 (J). Nucleus signal was excluded by masking from the DAPI channel. n = 5; t-test; ***p<0.001, **p<0.01, *p<0.05. (K?N) Lateral DIC images of hai1ahi2217 embryos at 24hpf (K, L) and 48hpf (M, N) untreated (K, M) or treated with 1.2 ÁM BI-D1870 (L) or 9 ÁM dimethyl fumarate (DMF). Locations of epidermal aggregates and loss of tail fin morphology in hai1a mutants, and their rescue by RSK inhibitor treatment are indicated by arrowheads. (O?Q) Lateral projected confocal images of the tails of embryos immunostained with antibodies against E-cadherin and TP63in WT (O, P) and hai1ahi2217 treated with DMF (Q). (O??Q?) Profile plots of fluorescence distribution across cells of WT (O), hai1ahi2217 (P?), and hai1ahi2217 treated with DMF (Q?). X-axis represents width of the cell. ?-Catenin immunofluorescence intensity (Y-axis) shows majority at cell edge (E-cadherin domain demarcated in light purple) and centre of cell (nucleus demarcated in light green) in WT and rescued hai11a mutants, but there is no clear membrane signal in the untreated hai1a mutants. Two cells per five larvae were analysed. Scale bars: (A, K, N) = 100 ÁM; (B, H) p=20 ÁM.
Image
Figure Caption
Acknowledgments
This image is the copyrighted work of the attributed author or publisher, and
ZFIN has permission only to display this image to its users.
Additional permissions should be obtained from the applicable author or publisher of the image.
Full text @ Elife

