
|
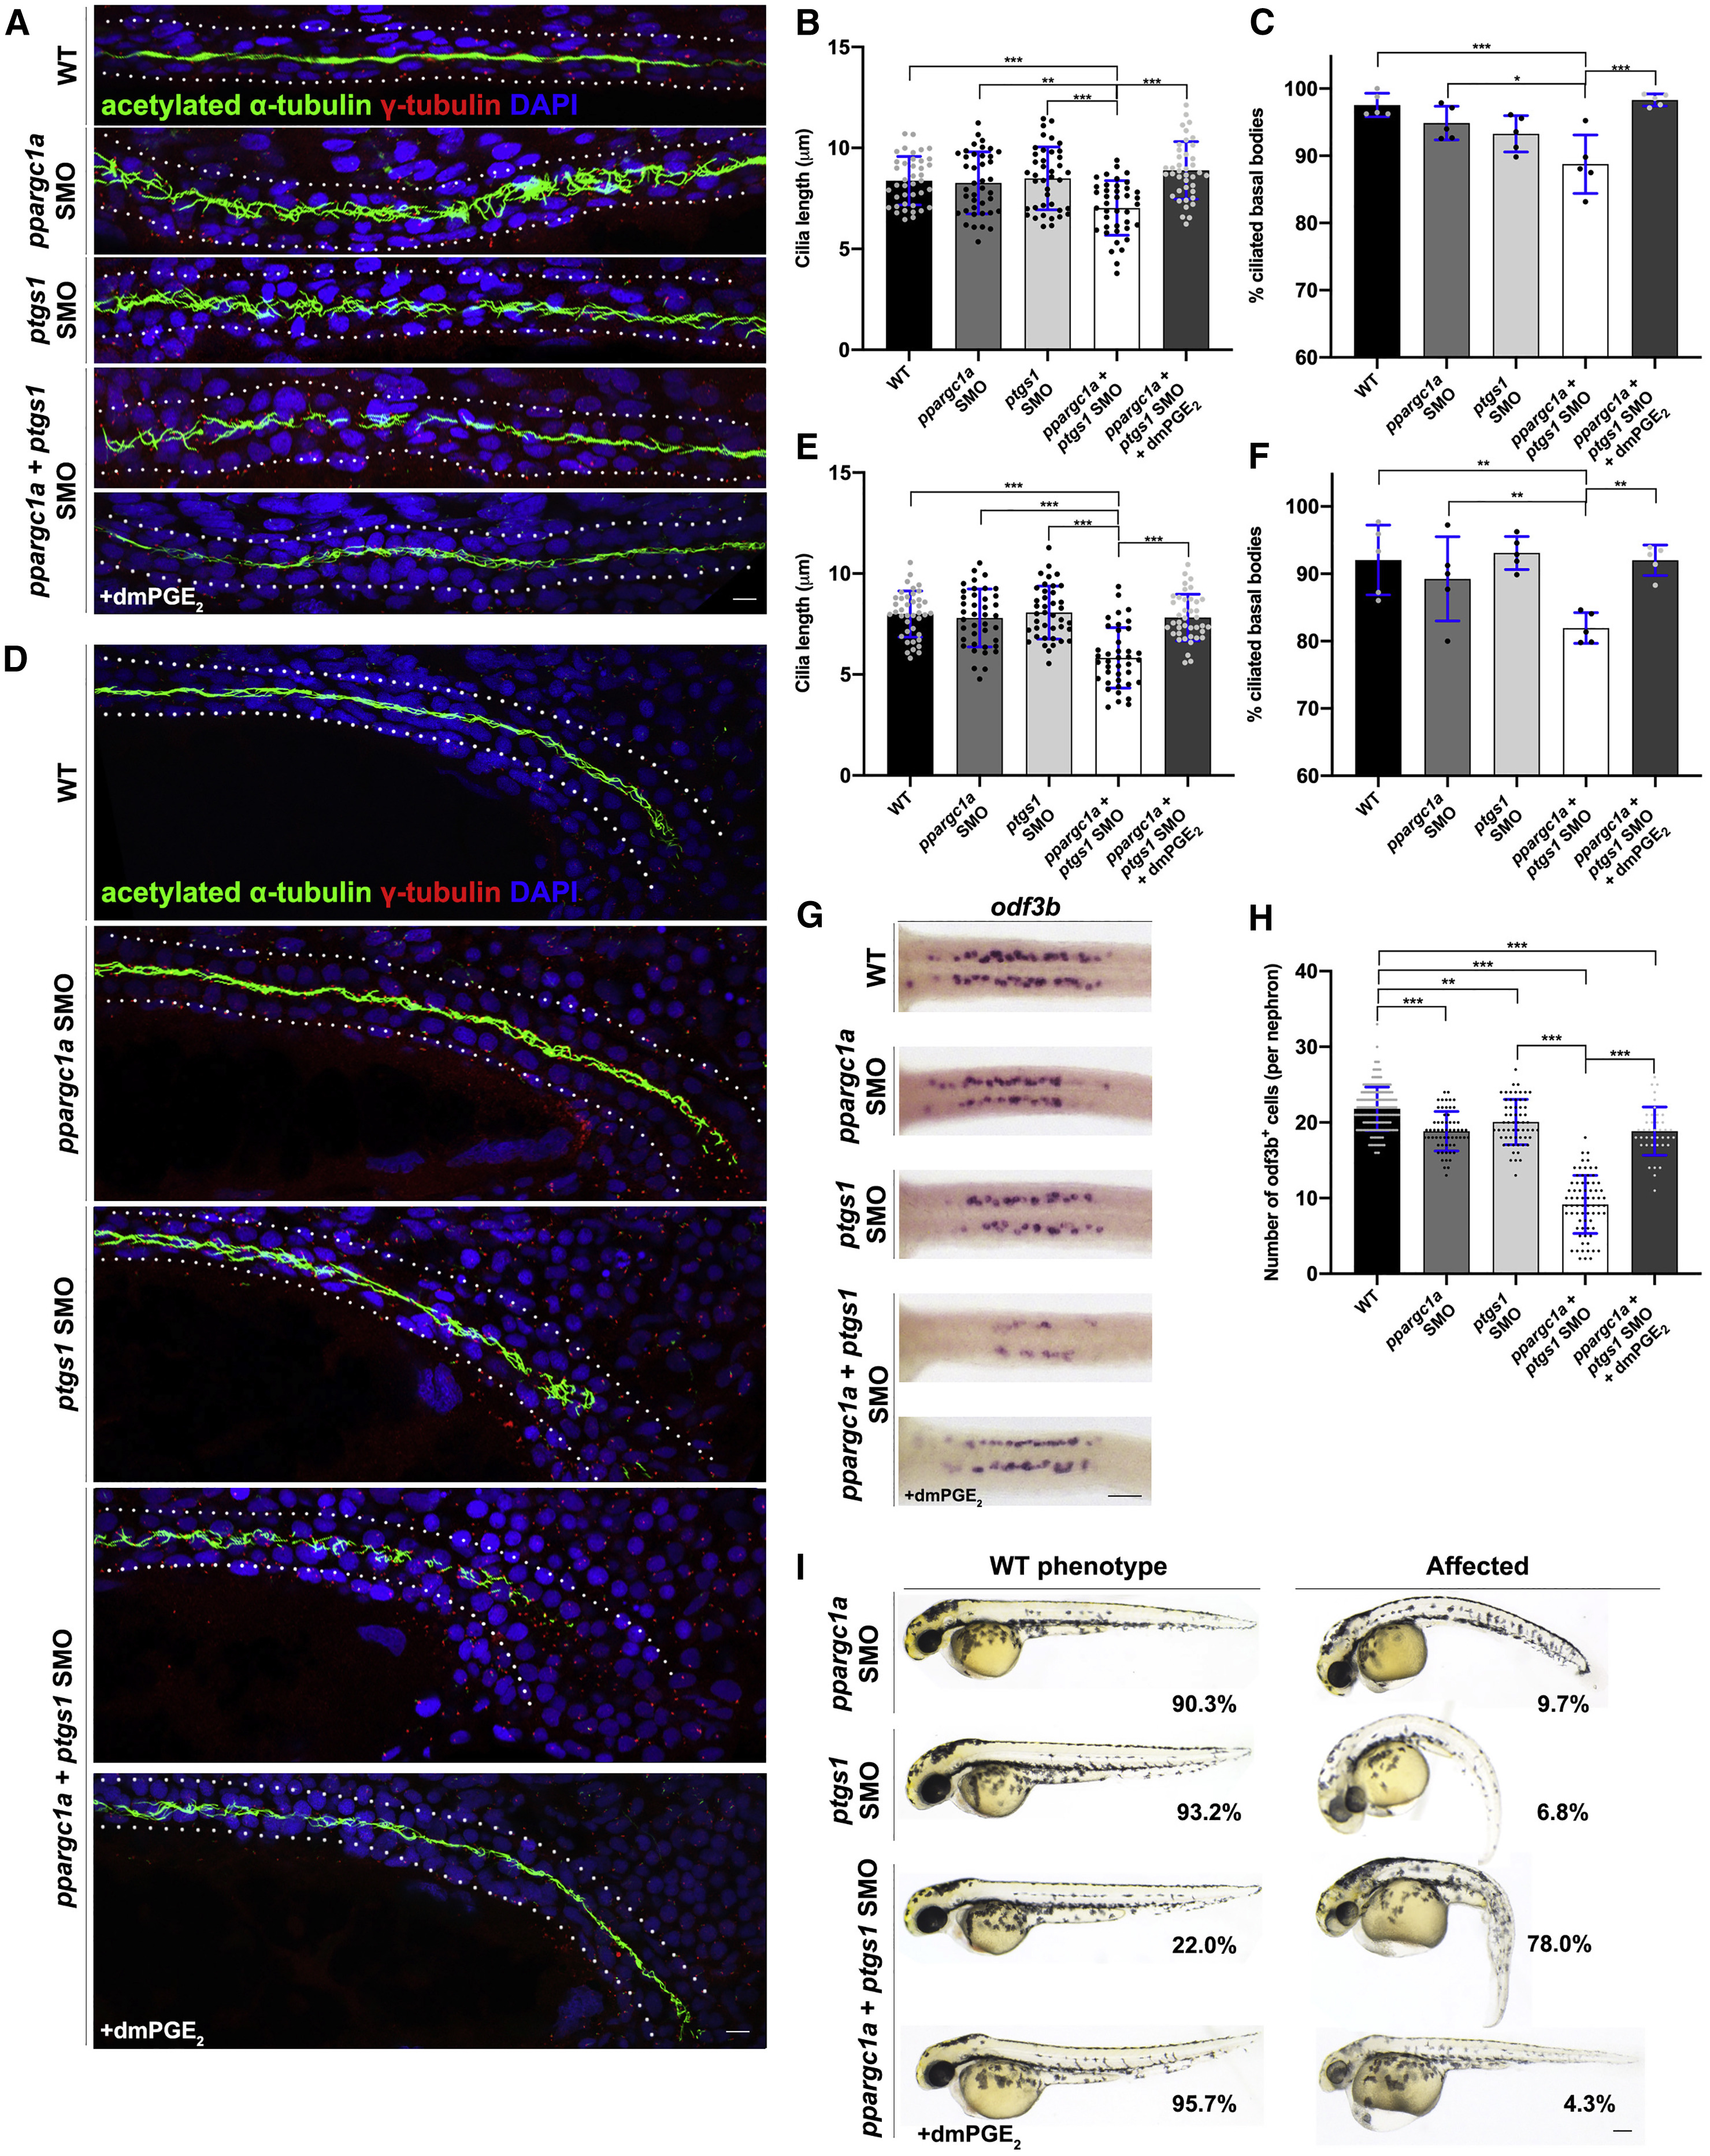
Fig. 4 ppargc1a and Prostaglandin Pathway Component ptgs1 Act Together to Properly Form Ciliated Cells
(A) Twenty-eight hours post-fertilization WT (top), ppargc1a suboptimal dose MO (SMO), ptgs1 SMO, ppargc1a + ptgs1 SMO, and ppargc1a + ptgs1 SMO + dmPGE2-treated zebrafish stained via whole-mount immunofluorescence for acetylated ?-tubulin (cilia, green), ?-tubulin (basal bodies, red), and DAPI in the proximal pronephros. Scale bar, 7 ?m.
(B) Cilia length in micrometers for the proximal pronephros.
(C) Graph of the percentage of ciliated basal bodies/total basal bodies per 100 ?m in the proximal pronephros.
(D) Twenty-eight hours post-fertilization WT (top), ppargc1a SMO, ptgs1 SMO, ppargc1a + ptgs1 SMO, and ppargc1a + ptgs1 SMO + dmPGE2-treated zebrafish stained via whole-mount immunofluorescence for acetylated ?-tubulin (cilia, green), ?-tubulin (basal bodies, red), and DAPI in the distal pronephros. Scale bar, 7 ?m.
(E) Cilia length in micrometers for the distal pronephros.
(F) Graph of the percentage of ciliated basal bodies/total basal bodies per 100 ?m in the distal pronephros.
(G) MCCs stained via WISH for odf3b at 24 hpf in WT, ppargc1a SMO, ptgs1 SMO, ppargc1a + ptgs1 SMO, and ppargc1a + ptgs1 SMO + dmPGE2-treated zebrafish. Scale bar, 50 ?m.
(H) Graph depicting the number of MCCs present.
(I) Forty-eight hours post-fertilization zebrafish injected with ppargc1a SMO, ptgs1 SMO, ppargc1a + ptgs1 SMO, and ppargc1a + ptgs1 SMO + dmPGE2-treated displaying either a WT phenotype (left) or an affected phenotype (right). The respective penetrance is listed within each image area. Scale bar, 100 ?m.
Data are represented as mean � SD. ?p < 0.05, ??p < 0.01, and ???p < 0.001 (one-way ANOVA); n.s., not significant.