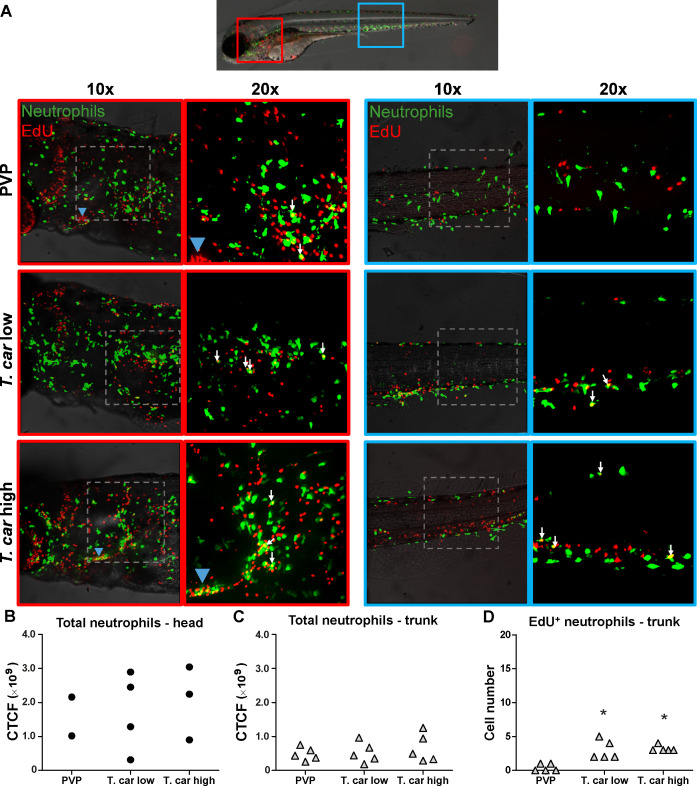
Figure 5 (A) Tg(mpx:GFP) were treated as described in Figure 4 (n = 4?5 larvae per group). Maximum projections of the head (left panels, red boxes) and trunk (right panels, blue boxes) regions of one representative individual in PVP, low- and high-infected zebrafish. Images capture neutrophils (green) and EdU+ nuclei (red). The images acquired at a ×20 magnification show that in all groups, EdU+ nuclei and GFP+ neutrophils only rarely overlapped (white arrows), and was marginally higher in infected than in non-infected PVP controls. Detailed analysis of the separate stacks selected to compose the overlay image of the head region of the high-infected larva (bottom left panel), revealed that none of the neutrophils in the area indicated by the blue arrowhead (thymus) were EdU+ (Video 3). (B?C) Corrected total cell fluorescence (CTCF) calculated in the head (B) and trunk (C) region of larvae described in A. Symbols indicate individual larvae (n = 4?5 per group from two independent experiments). ** indicates significant differences between CTCF in the head and trunk regions, as assessed by Two-Way ANOVA followed by Bonferroni post-hoc test. (D) Tg(mpx:GFP) were treated as described in A and the number of EdU+ neutrophils in the trunk region of PVP, low- and high-infected larvae was calculated. Symbols indicate individual larvae (n = 5 per group from two independent experiments). * indicates significant differences to the PVP control as assessed by One-Way ANOVA followed by Bonferroni post-hoc test.
Image
Figure Caption
Figure Data
Acknowledgments
This image is the copyrighted work of the attributed author or publisher, and
ZFIN has permission only to display this image to its users.
Additional permissions should be obtained from the applicable author or publisher of the image.
Full text @ Elife

