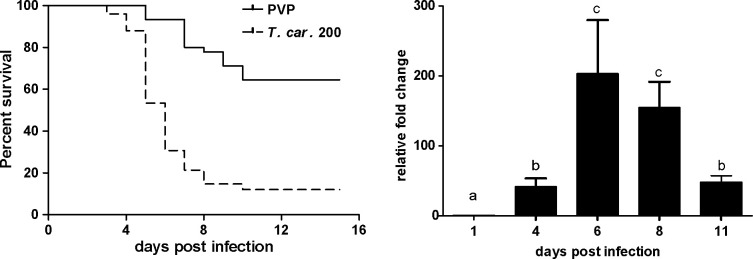
Figure 1 (A) Tg(mpeg1:mCherry-F;mpx:GFP) larvae (5 dpf) were injected intravenously with n = 200 T. carassii/fish or with PVP as control and survival was monitored over a period of 15 days. (B) Tg(mpeg1:mCherry-F;mpx:GFP) zebrafish (5 dpf) were treated as in A and sampled at various time points. At each time point, three pools of 3?5 larvae were sampled for real-time quantitative PCR analysis. Relative fold change of the T. carassii-specific heat-shock protein-70 (hsp70) was normalised to the zebrafish-specific ef1? and expressed relative to the trypanosome-injected group at time point zero. Bars indicate average and standard deviation (SD) on n = 3 pools per time point. Letters indicate significant differences (p<0.05), as assessed using One-way ANOVA followed by Tukey?s multiple comparisons test.
Image
Figure Caption
Figure Data
Acknowledgments
This image is the copyrighted work of the attributed author or publisher, and
ZFIN has permission only to display this image to its users.
Additional permissions should be obtained from the applicable author or publisher of the image.
Full text @ Elife

