
|
Figure 5
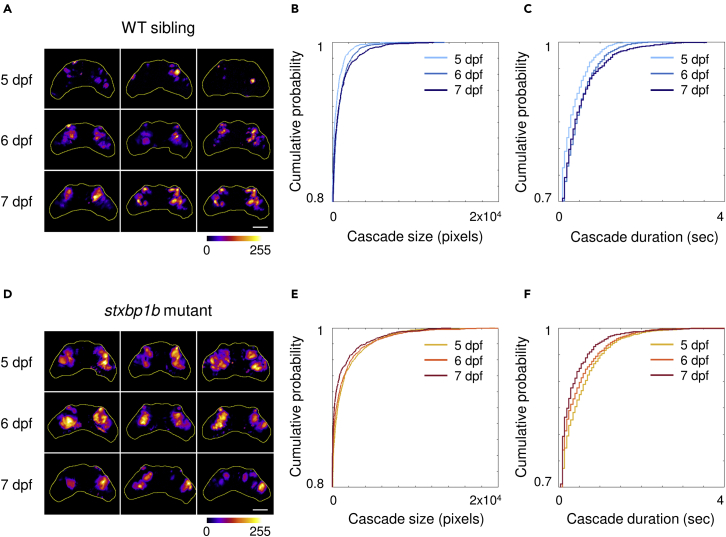
Cumulative distribution of cascade size and duration
(A) Representative stack summation of binary time series from WT siblings on different days post fertilization (dpf). Each tile represents one fish. The cumulative intensity of activation is color coded as shown in the color bar.
(B) Cumulative distribution of cascade sizes and durations from WT siblings on different dpf (light blue, 5 dpf; blue, 6 dpf; dark blue, 7 dpf).
(C) Representative time series stack summation from
(D) Cumulative distribution of cascade sizes and durations from