IMAGE

Fig. 3

ID
ZDB-IMAGE-210614-19
Antibodies
Source
Figures for Karampelias et al., 2021
Image
Figure Caption

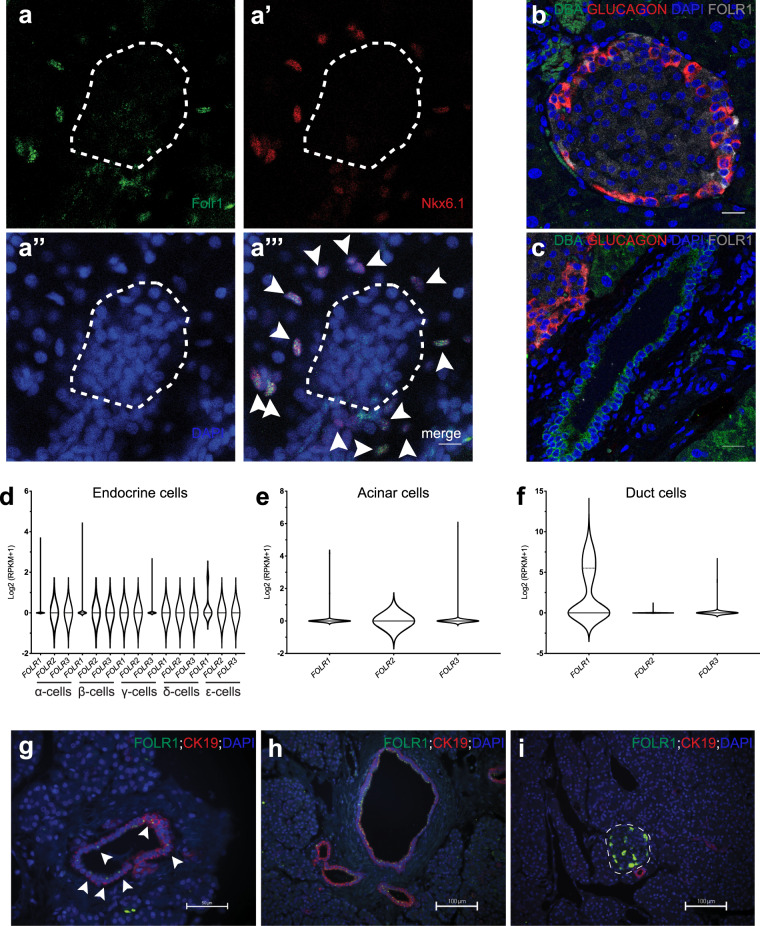
Fig. 3 Expression of Folr1 in the pancreata of different organisms.

aa”’, Immunostaining of whole-mount zebrafish larvae at 6 dpf using a Folr1 antibody (a). Ductal cells were immunostained with the zebrafish duct-specific marker Nkx6.1 (a’), and nuclei were counterstained with DAPI (a”). The white dashed line outlines the islet of the zebrafish larvae. Arrowheads (a”’) point to the Folr1+ ductal cells. Scale bar, 10 μm. Representative images are shown from one larva. The staining results have been repeated in at least four zebrafish larvae and three biological replicates. b, c Representative pictures of an islet (b) and a duct (c) from adult mouse pancreatic sections immunostained for FOLR1, GLUCAGON (α-cell marker), and DBA (ductal cell marker) and counterstained with DAPI. Scale bar, 20 μm. Sections from three biological replicates showed the same expression pattern of FOLR1. di Expression of folate receptor homologs in the human pancreas. Violin plots showing single-cell RNA-Seq expression in endocrine (d), acinar (e), and ductal (f) pancreatic cells showed significant expression of FOLR1 in a subset of duct cells. The expression pattern of FOLR1 found in the single-cell RNA-Seq data was confirmed with immunofluorescence analysis of human pancreatic sections (gi). The white dashed line outlines the islet in (i). Arrowheads in g point to the subset of ductal cells expressing FOLR1, whereas essentially all ductal cells in the large duct in (h) are FOLR1+. Scale bars are indicated on the images. The staining pattern was consistent in pancreata from eight different donors.

Figure Data
Acknowledgments
This image is the copyrighted work of the attributed author or publisher, and ZFIN has permission only to display this image to its users. Additional permissions should be obtained from the applicable author or publisher of the image. Full text @ Nat. Commun.