IMAGE

Figure 6

ID
ZDB-IMAGE-210611-63
Genes
Antibodies
Source
Figures for Crouzier et al., 2021
Image
Figure Caption

Figure 6

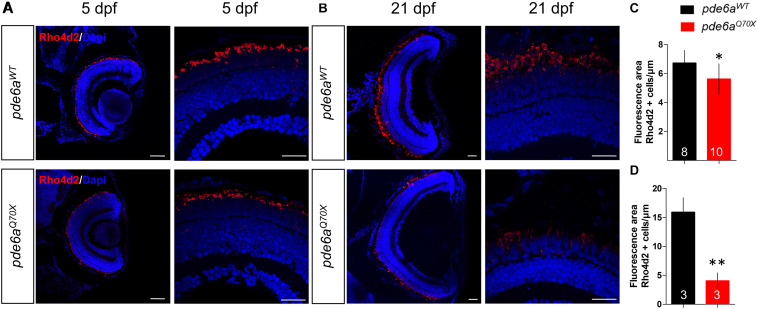
Analysis of rods in pde6aQ70X zebrafish during development. Representative confocal images of the retina of pde6aWT and pde6aQ70X zebrafish obtained after immunostaining of rods with a Rho4d2 antibody highlighting Rhodopsin (red) at 5 dpf (A) and 21 dpf (B). The nuclei were counterstained with DAPI (blue). Scale bar = 30 μm. (C,D) Quantification of the total area of rod outer segments normalized against the length of the retinal section, based on three independent measurements of larvae per group at 5 dpf (C) and 21 dpf (D). The number of animals is indicated within the columns. p < 0.05, ∗∗p < 0.01.

Figure Data
Acknowledgments
This image is the copyrighted work of the attributed author or publisher, and ZFIN has permission only to display this image to its users. Additional permissions should be obtained from the applicable author or publisher of the image. Full text @ Front Cell Dev Biol