IMAGE

Fig. 6

ID
ZDB-IMAGE-210611-38
Source
Figures for Griffin et al., 2021
Image
Figure Caption

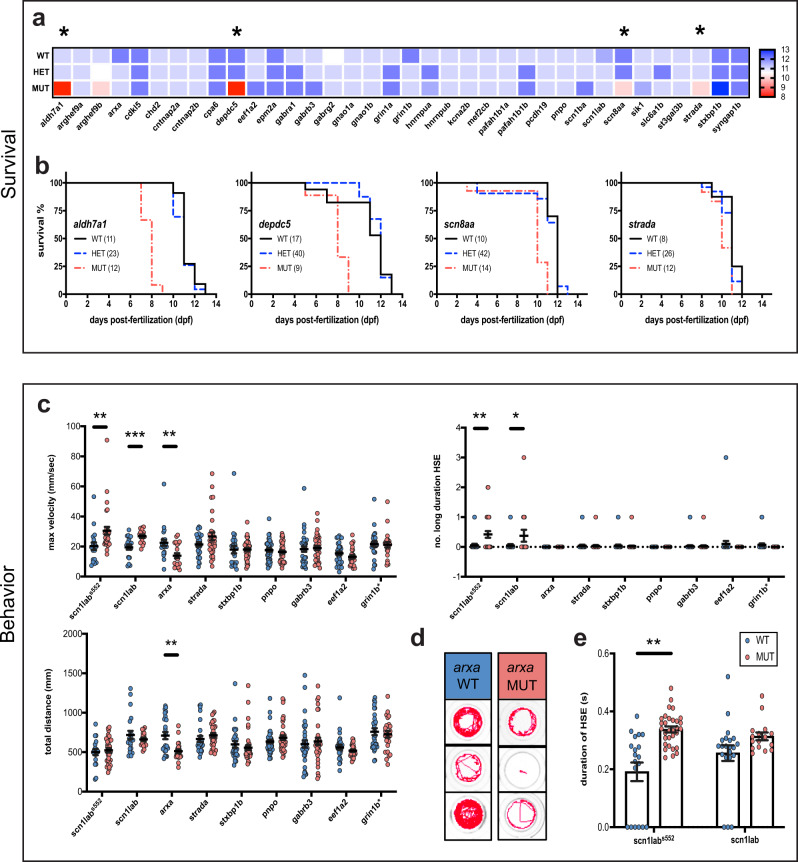
Fig. 6 Survival and behavioral phenotypes.

a Heatmap displaying median wild-type (WT), heterozygote (HET), and homozygote mutant (MUT) larval survival for EZP lines. Range extends from 8 dpf (red) to 13 dpf (blue). Asterisks indicate MUTs with significant survival deficits compared WT control siblings; p < 0.05, log rank test. b Lines with significant survival deficits. c Quantification of the basal locomotor activity of epileptic lines after 1 hr habituation in DanioVision chamber. Maximum velocity and total distance traveled were extracted directly from EthoVision XT 11.5 software while the number of events ≥28 mm/s, termed high-speed events (HSE), and long duration HSE (≥ 1 s) were scored using a MATLAB algorithm (scn1lab552 WT N = 19 larvae, MUT N = 31 larvae; scn1lab WT N = 21 larvae, MUT N = 16 larvae; arxa WT N = 25 larvae, MUT N = 22 larvae; strada WT N = 27 larvae, MUT N = 31 larvae; stxbp1b WT N = 26 larvae, MUT N = 43 larvae; pnpo WT N = 42 larvae, MUT N = 40 larvae; gabrb3 WT N = 35 larvae, MUT N = 36 larvae; eef1a2 WT N = 30 larvae, MUT N = 27 larvae and grin1b WT N = 29 larvae and HET = 57 larvae). d Representative traces of arxa WT and MUT movement. e Comparison of duration of HSE in scn1lab ENU and CRISPR larvae. Data displayed as mean ± SEM, one-way ANOVA was used to determine the significance of both HET and MUT behavior for all lines (Supplementary Figure 4). Post hoc Dunnett multiple comparison test, *p ≤ 0.05, **p ≤ 0.005, **p < 0.0001.

Figure Data
Acknowledgments
This image is the copyrighted work of the attributed author or publisher, and ZFIN has permission only to display this image to its users. Additional permissions should be obtained from the applicable author or publisher of the image. Full text @ Commun Biol