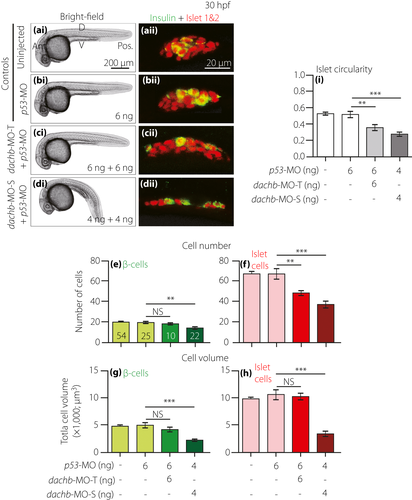
Fig. 5 Comparison of dachb knockdown with translation-blocking morpholino (dachb-MO-T) and splice-blocking dachb-MO (dachb-MO-S) on the development of the pancreatic islet. Embryos were (a) uninjected (control) or they were injected at the one-cell stage with (b) 6 ng p53-MO (control), (c) 6 ng dachb-MO-T + 6 ng p53-MO or (d) 4 ng dachb-MO-S + 4 ng p53-MO. (ai?di) Bright-field images were acquired at 30 hpf, after which the embryos were whole-mount double-immunolabeled with antibodies to insulin (green) and islet 1 and 2 (red) to show the localization of the ?-cells and islet cells in the endocrine pancreas, respectively. (aii?dii) These are all single optical sections taken through the middle of the pancreatic islet. (e,f) The number of (e) ?-cells and (f) islet cells, and (g,h) the volume of (g) ?-cells and (h) islet cells. (i) The circularity of the pancreatic islet. The data are presented as the mean ± standard error of n = 10 to 54 embryos, such that the number is shown in the respective bars in panel (e). The asterisks indicate significant differences at P < 0.01** or P < 0.001*** using the Mann?Whitney U-test. Ant., anterior; D, dorsal; NS, not significant; Pos. posterior; V, ventral.
Image
Figure Caption
Figure Data
Acknowledgments
This image is the copyrighted work of the attributed author or publisher, and
ZFIN has permission only to display this image to its users.
Additional permissions should be obtained from the applicable author or publisher of the image.
Full text @ J Diabetes Investig

