IMAGE

Fig. 4

ID
ZDB-IMAGE-210603-25
Genes
Antibodies
Source
Figures for Kindt et al., 2021
Image
Figure Caption

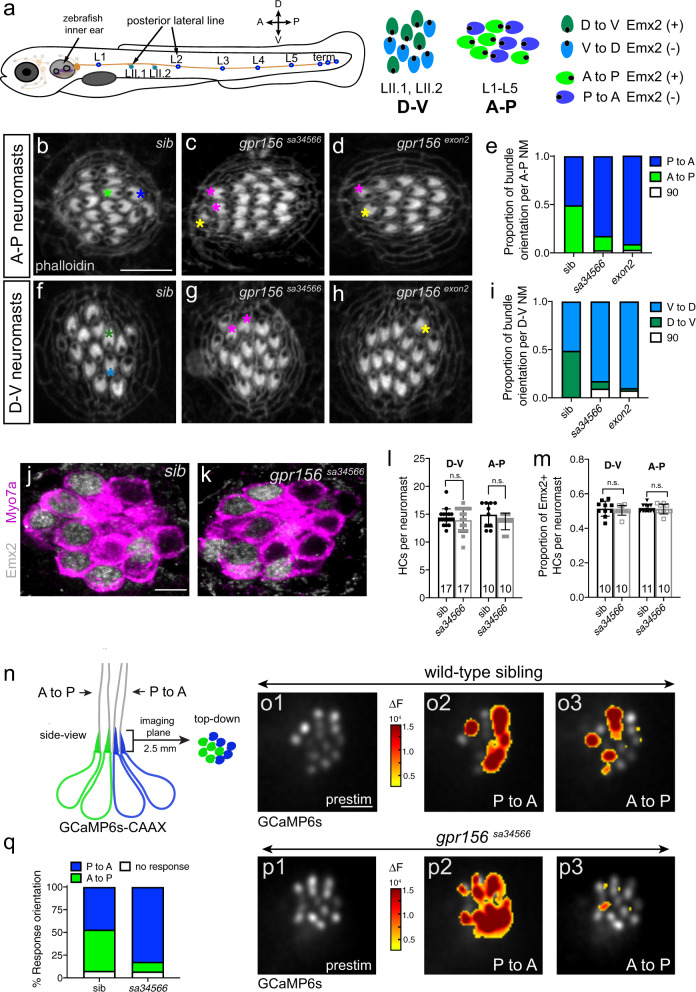
Fig. 4 Gpr156 dictates hair cell orientation reversal and directional sensitivity in zebrafish neuromasts.

a Schematic of the lateral-line system in a 5 day-post-fertilization zebrafish. Neuromast HCs show binary orientation along the antero-posterior (A–P) or dorso-ventral (D–V) axis as depicted. Emx2 is only expressed in HCs of one orientation in each neuromast (green D to V and A to P HCs). HC orientation is indicated by a black dot representing the off-center basal body. bi Phalloidin labeling in neuromasts reveals HC orientation by the lack of signal above the off-center basal body. In wild-type siblings (b, e, f, i), neuromasts contain an equal proportion of HCs with either orientation. In gpr156 mutants (ce, gi), there are more P to A (ce) and V to D (gi)-oriented HCs compared to wild-type siblings (Tukey’s multiple comparison test, P to A exon2 allele p < 0.0001, sa34566 allele p < 0.0001; V to D exon2 allele p < 0.0001, sa34566 allele p < 0.0001). Green and blue asterisks highlight the two HC orientations in wild-type sibling neuromasts. Magenta and yellow asterisks highlight outlier HCs oriented 180° or 90° compared to the majority of HCs in gpr156 mutants. n = 10 neuromasts and N ≥ 8 animals per genotype, examined at 5 dpf. j, k Emx2 and Myo7a co-labeling in neuromasts. Wild-type siblings and gpr156 mutants neuromasts have a similar number of HCs (l) (mean ± SEM; unpaired t-test (two-tailed), A-P p = 0.1686; Mann–Whitney test (two-tailed), D-V p = 0.8547), and a similar proportion of HCs express Emx2 per neuromast (m) (mean ± SEM; unpaired t-test (two-tailed), A-P p = 0.5756; Mann–Whitney test (two-tailed), D-V p = 0.4805). In lm the number of neuromasts (n) examined at 5 dpf in N ≥ 8 animals per genotype is indicated. n Scheme showing the GCaMP6s calcium reporter (blue and green) and the imaging plane in a neuromast. o1, p1 Baseline gray scale GCaMP6s images of the hair bundle imaging plane in wild-type siblings (o1) and gpr156 mutants (p1; sa34566 allele). o2, o3, p2, p3 Spatial patterns of GCaMP6s calcium signal increases in hair bundles during P to A (o2, p2) or A to P (o3, p3) directed fluid-jet stimulation. GCaMP6s signals are colorized according to the ∆F heat maps and superimposed onto prestimulus (prestim) baseline images (o1, p1). q In wild-type siblings, GCaMP6s signals are detected during both P to A and A to P directed stimulation (o2, o3). In contrast, compared to wild-type, in gpr156 mutants, significantly more hair bundles respond to P to A directed stimulation (p2p3) (Sidak’s multiple comparison test, P to A p = 0.0008; n = 8 neuromasts per genotype and N = 4 wild-type and N = 3 mutant animals, examined at 5 dpf. See Supplementary Fig. 4 for individual HC responses). NM, neuromast; sib, wild-type sibling. Scale bars are 5 µm (bd and fh, j, k, o13, and p1p3).

Figure Data
Acknowledgments
This image is the copyrighted work of the attributed author or publisher, and ZFIN has permission only to display this image to its users. Additional permissions should be obtained from the applicable author or publisher of the image. Full text @ Nat. Commun.