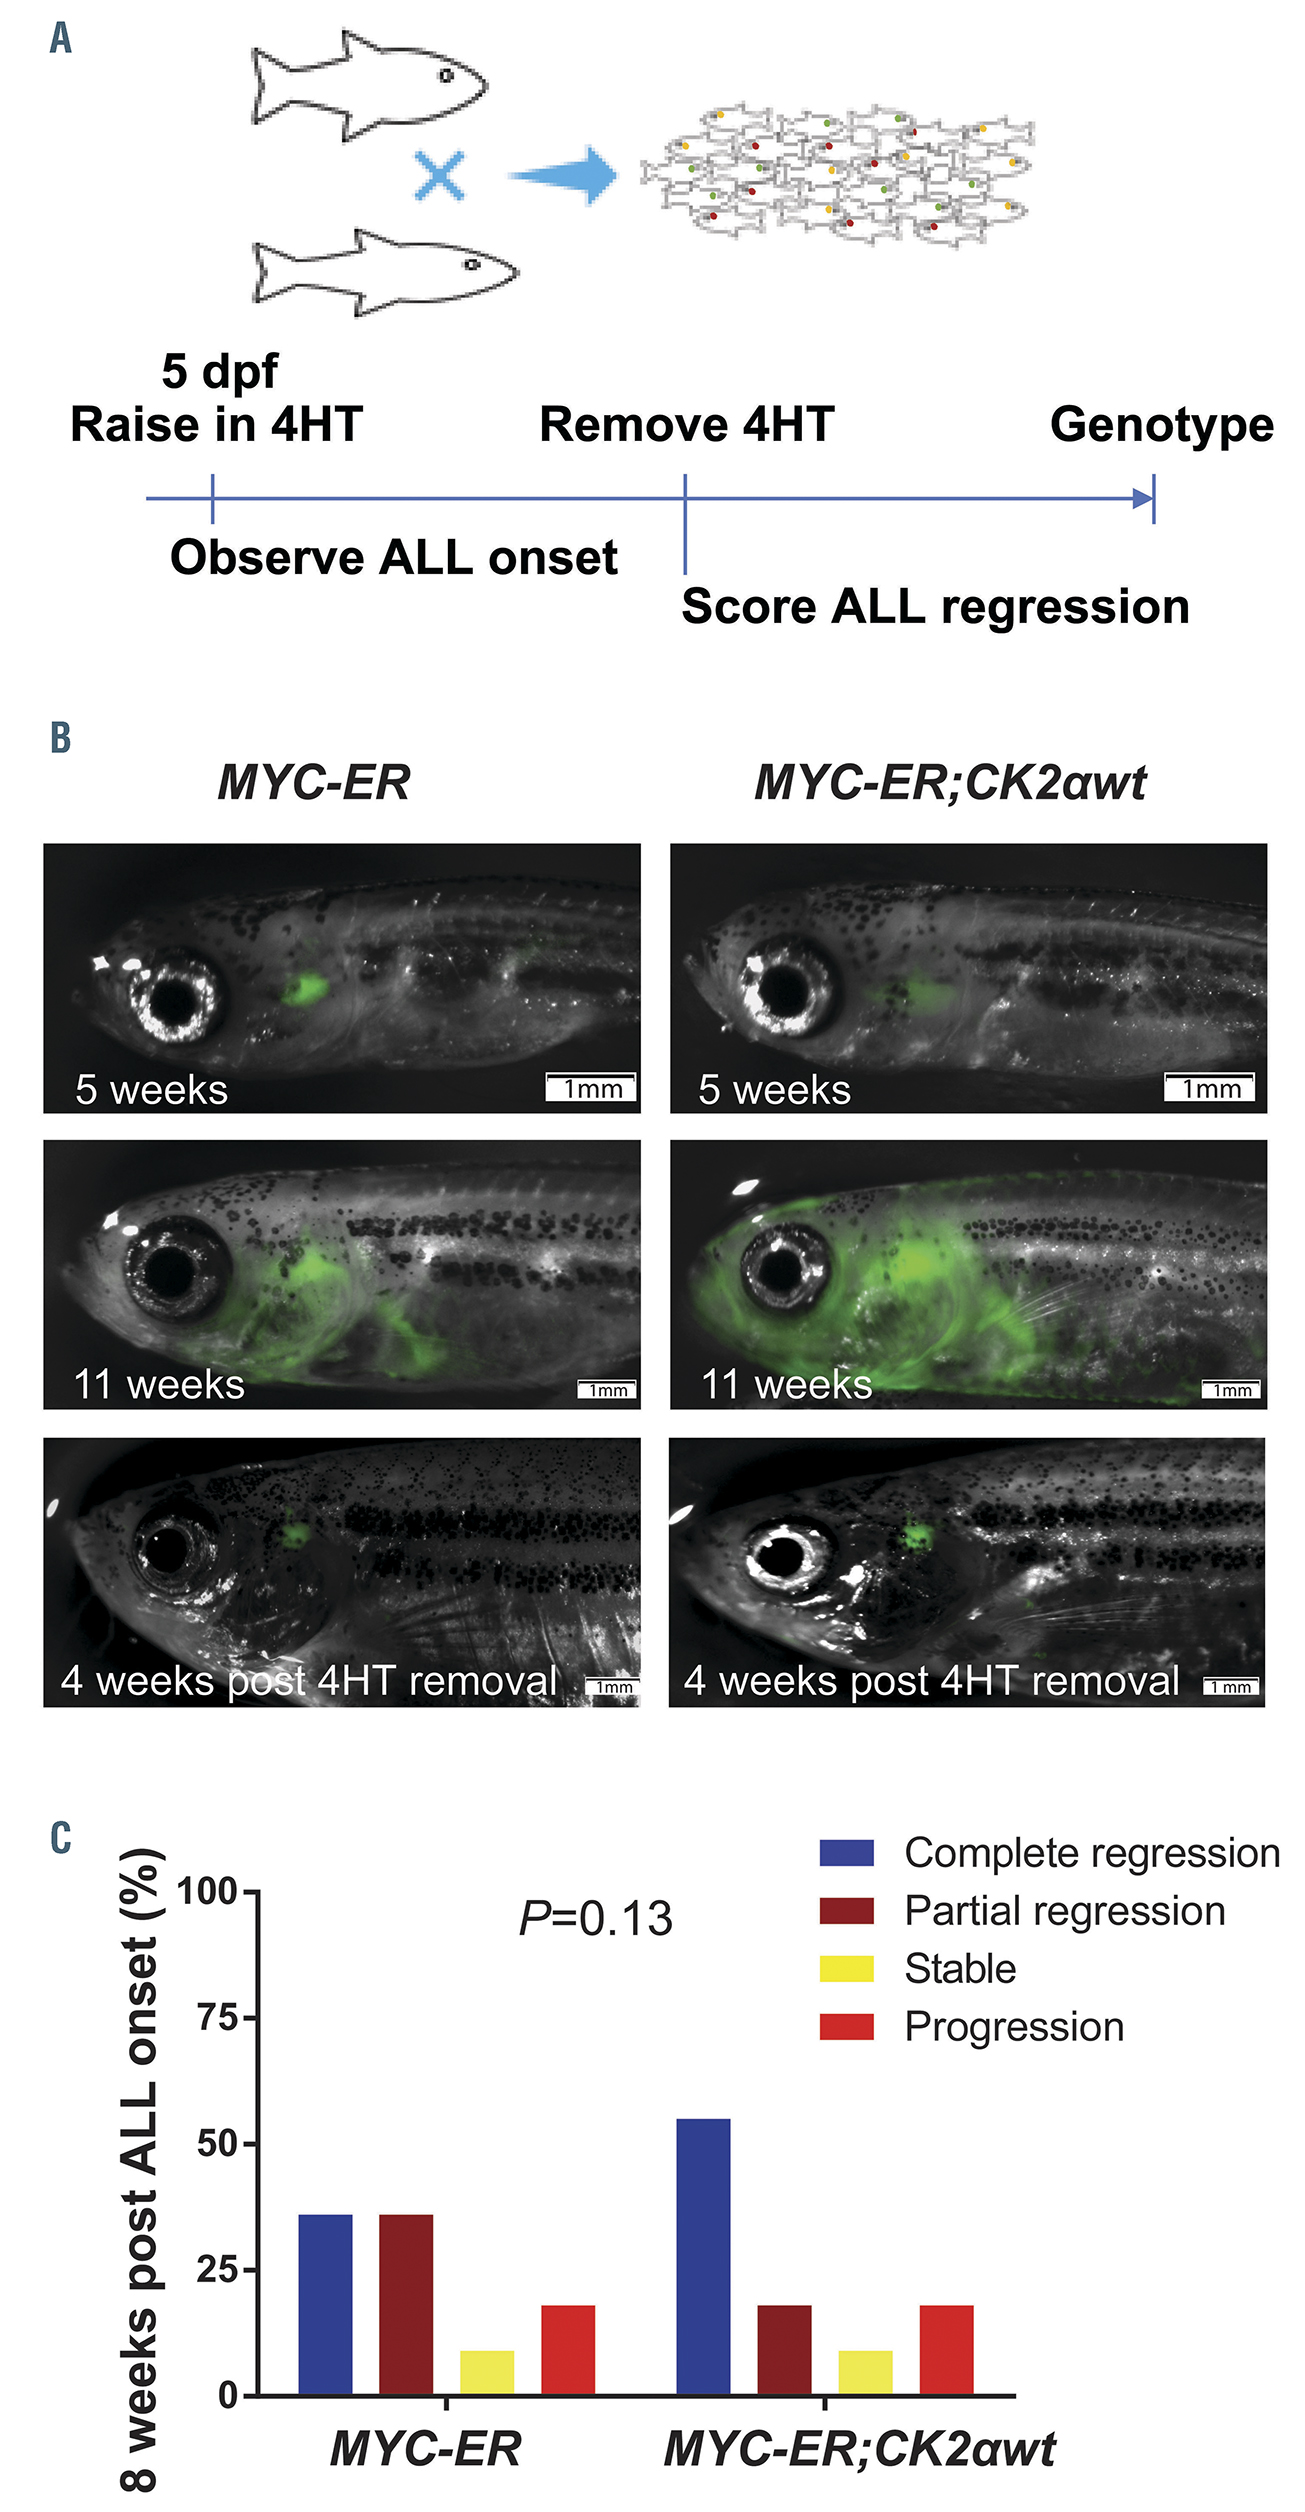
Fig. 3 CK2? overexpression alone cannot maintain acute lymphoblastic leukemia in the absence of aberrant MYC activation. (A) Diagram of the experimental design. (B, top panel) Thymic fluorescence in MYC-ER (left) and MYC-ER;CK2?wt (right) zebrafish raised in 129 nM 4-hydroxytamoxifen (4HT) for 5 weeks showing tumor initiation in MYC-ER;CK2?wt fish. (B, middle panel) shows both MYC-ER (left) and MYC-ER;CK2?wt (right) with aggressive disease at 11 weeks although MYCER; CK2?wt fish developed more aggressive ALL than MYC-ER fish. (B, bottom panel) shows thymic fluorescence 4 weeks after 4HT withdrawal. One representative fish is shown for each group. (C) Zebrafish were classified by the indicated tumor phenotype at 8 weeks post 4HT removal (P=0.13; MYC-ER vs. MYCER; CK2?wt; n=11 per group). The difference in observed tumor phenotypes between each group as a whole was statistically insignificant, as calculated by a two-way ANOVA test. Scale bars =1 mm. ALL: acute lymphoblastic leukemia.
Image
Figure Caption
Acknowledgments
This image is the copyrighted work of the attributed author or publisher, and
ZFIN has permission only to display this image to its users.
Additional permissions should be obtained from the applicable author or publisher of the image.
Full text @ Haematologica

