IMAGE

Fig. 3.

ID
ZDB-IMAGE-210518-94
Genes
Source
Figures for Oprişoreanu et al., 2021
Image
Figure Caption

Fig. 3.

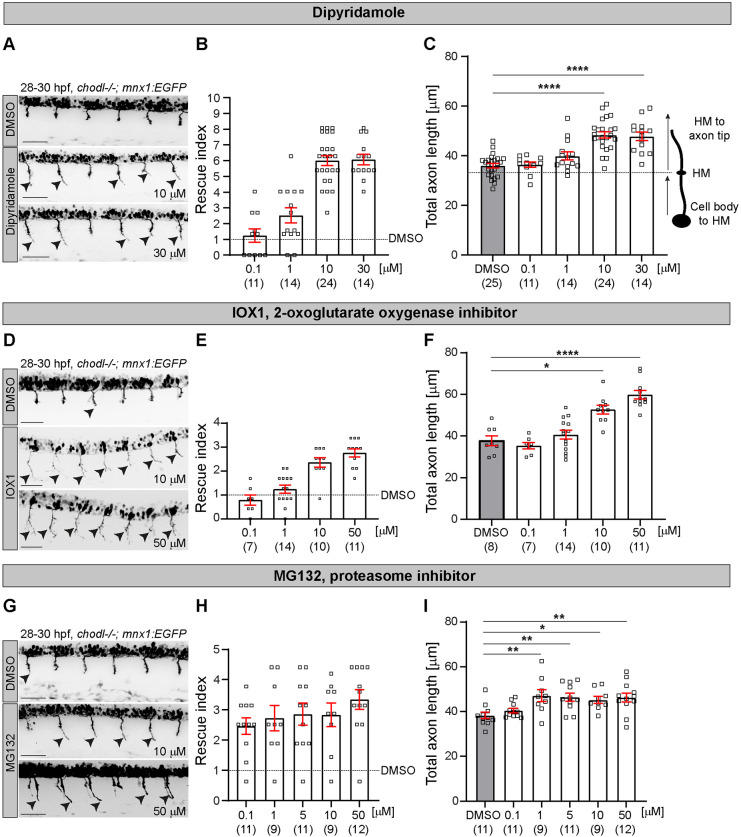
Rescue of the axonal phenotype of the chodl−/− mutant at different concentrations of top drug hits. (A,D,G) Representative images of the lateral view of chodl mutants treated with DMSO (control), dipyridamole (10 μm or 30 μm; A), IOX1 (10 μm or 50 μm; D) or MG132 (10 μm or 50 μm; G). Arrowheads indicate CaP motor axons beyond the HM. Scale bars: 50 µm. (B,E,H) Plotted is the growth of CaP motor axons beyond the HM in response to different concentrations of dipyridamole (B), IOX1 (E) or MG132 (H), as rescue index over drug concentration. Treatment with IOX1 shows a dose-dependent rescue of the axonal phenotype in chodl mutants. (C,F,I) Quantification of the total CaP axon length after treatment with dipyridamole (C), IOX1 (F) or MG132 (I) at different concentrations compared with the total length of Cap axons treated with DMSO (control DMSO-chodl mutant). Treatment with dipyridamole (C), one-way ANOVA ****P<0.0001 with Dunnett's multiple comparison test, ****P<0.0001, statistical power=1.0000. Treatment with IOX1 (F), Kruskal–Wallis test ****P<0.0001 with Dunn's multiple comparison test ****P<0.0001, *P=0.0177, statistical power=0.9940. Treatment with MG132 (I), one-way ANOVA **P=0.0022 with Dunnett's multiple comparison test: DMSO vs 1 µM **P=0.0060, DMSO vs 5 µM **P=0.0078, DMSO vs 10 µM *P=0.0422, DMSO vs 50 µM **P=0.0077, statistical power=0.9473). Each data point represents one animal and n numbers are indicated in parenthesis. Error bars represent means±s.e.m.

Figure Data
Acknowledgments
This image is the copyrighted work of the attributed author or publisher, and ZFIN has permission only to display this image to its users. Additional permissions should be obtained from the applicable author or publisher of the image. Full text @ Dis. Model. Mech.