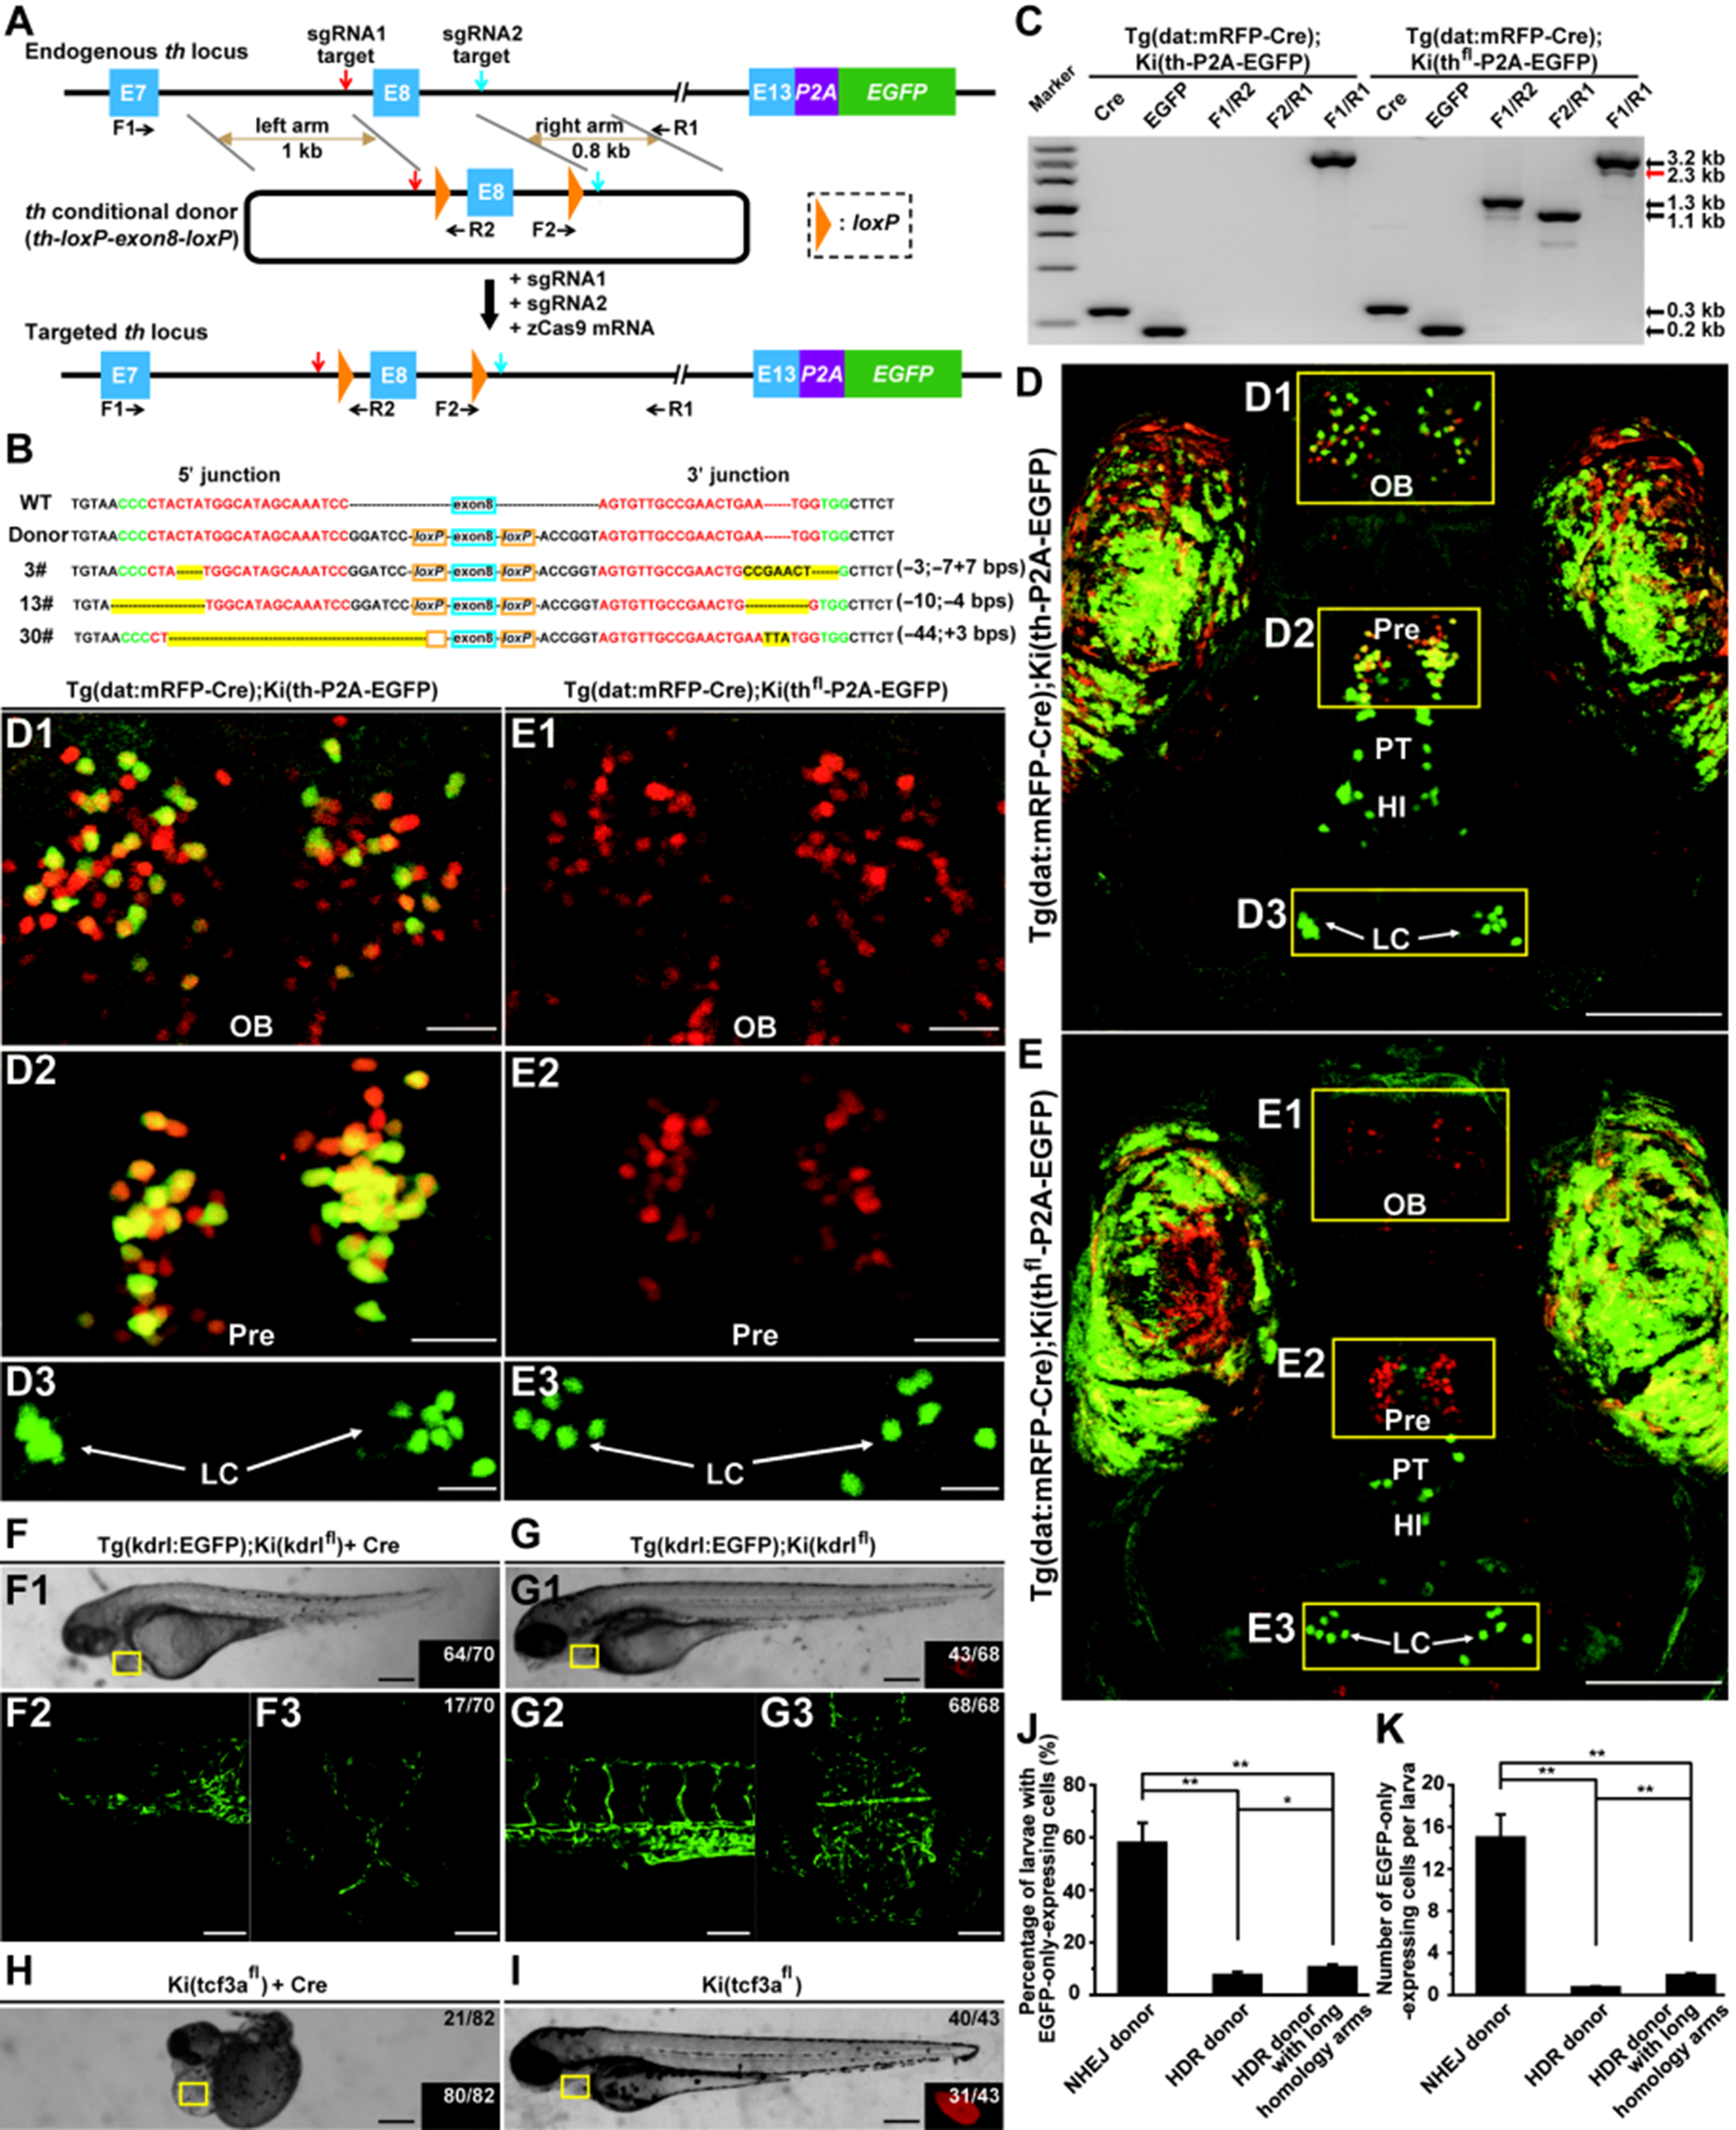
Fig. 1 NHEJ-mediated replacement approach for efficient generation of conditional alleles in zebrafish. (A) Schematic of the strategy for NHEJ-mediated DNA replacement at the th locus of Ki(th-P2A-EGFP) zebrafish. The sgRNA1 and sgRNA2 targets are indicated by red and blue arrows, respectively. E7, E8, and E13 represent the 7th, 8th, and 13th exons, respectively. The primers (F1, R1, F2, R2) for verification are indicated by short black arrows. (B) 5? and 3? junction sequences of F1 progenies of three founders carrying DNA replacement in comparison with the sequences of wild-type (WT) zebrafish and the donor vector. The indel mutations are highlighted in yellow, and the protospacer adjacent motif (PAM) and sgRNA target sequences are shown in green and red, respectively. The indels at the 5? and 3? junctions are shown in the brackets at right. (C) PCR verification of conditional knockout, showing an additional product at ?2.3 kb (red arrow), in principle excised from the original 3.2-kb fragment by Cre. (D and E) Projected in vivo confocal images (dorsal view) of [Tg(dat:mRFP-Cre);Ki(th-P2A-EGFP)] (D) and [Tg(dat:mRFP-Cre);Ki(thfl-P2A-EGFP)] (E) larvae at 5 days post-fertilization (dpf), showing that in the conditional knockout embryo, mRFP-Cre-expressing cells (in red) do not express EGFP. The enlarged views of the areas outlined by the rectangles in D and E are shown in D1?D3 and E1?E3, respectively. HI, intermediate hypothalamus; LC, locus coeruleus; OB, olfactory bulb; Pre, pretectum; PT, posterior tubercular. (F and G) Generation of the kdrl conditional allele. In vivo bright-filed (top) and projected confocal (bottom) images of 3-dpf [Tg(kdrl:EGFP);Ki(kdrlfl)] intercross larvae with (F) or without (G) Cre mRNA injection at one-cell stage, showing that Cre mRNA injection causes the loss of DsRed expression in the heart (inset in F1) and the defects of blood vessels in the trunk (F2) and brain (F3). (H and I) Generation of the tcf3a conditional allele. Bright-filed image of 2.5-dpf Ki(tcf3afl) intercross larvae with Cre mRNA injection showing the defects of gross morphology (H). (J and K) Comparison of the efficiencies of NHEJ- and HDR-mediated DNA replacement at the gfap locus. (J) Percentage of larvae with EGFP-only-expressing glial cells. (K) Average number of EGFP-only-expressing glial cells per larva. n?=?170, 277, and 245. *P?
Image
Figure Caption
Acknowledgments
This image is the copyrighted work of the attributed author or publisher, and
ZFIN has permission only to display this image to its users.
Additional permissions should be obtained from the applicable author or publisher of the image.
Full text @ J. Mol. Cell Biol.

