IMAGE

FIGURE 2

ID
ZDB-IMAGE-210428-81
Source
Figures for Dhakal et al., 2021
Image
Figure Caption

FIGURE 2

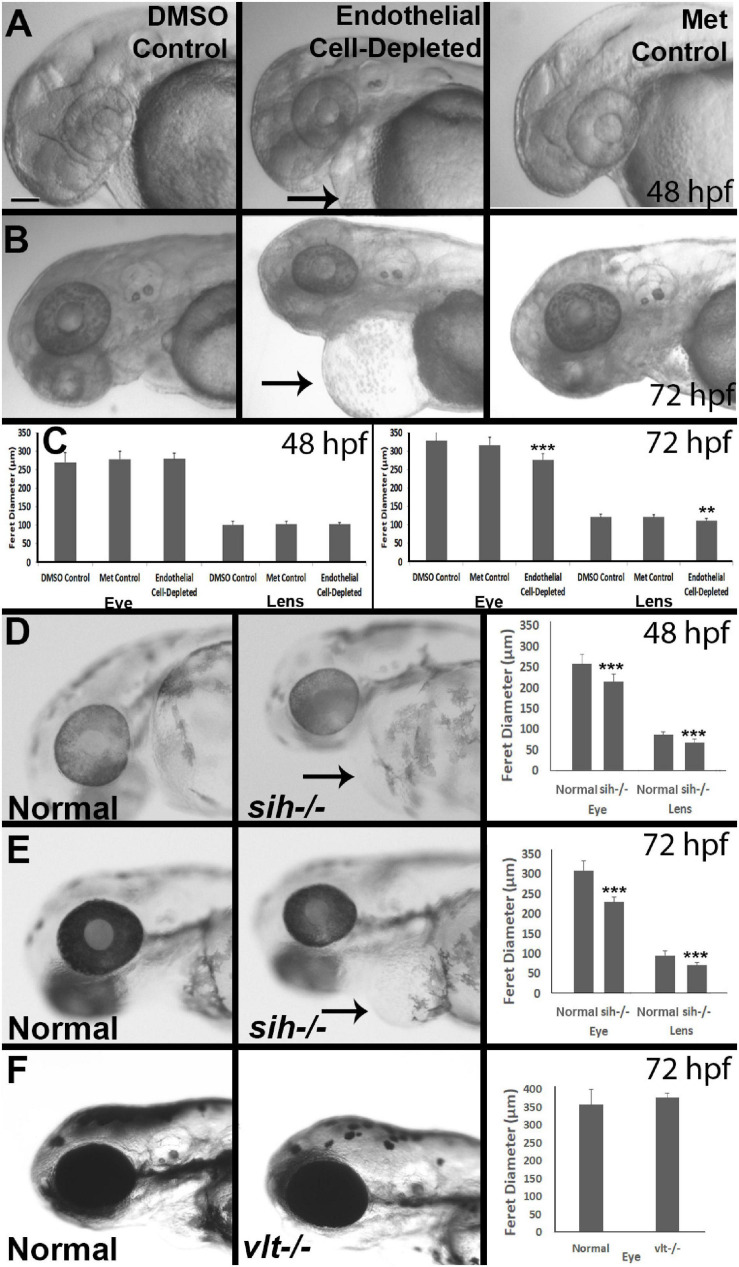
Eye and lens sizes in cardiovascular disruption model systems. (A,B) Live, doubly-transgenic (cdh5:gal4; UAS:nfsB-mCherry), DMSO-treated (DMSO Control), Met-treated (Endothelial Cell-Depleted), and Met-treated clutchmates (Met controls) viewed at 48 hpf (A) and 72 hpf (B). Arrows in middle panel of each indicate swollen epicardial sac. (C). Graphs show average (±s.d.) Feret diameter of eyes and lenses; statistical analysis by ANOVA and Tukey post hoc (48 hpf; n = 15 per condition) and Kruskal-Wallis and Conover’s post hoc (72 hpf; n = 15 DMSO, 14 Met control, and 12 Endothelial cell-depleted). (D,E) Live, normal clutchmates and sih–/– embryos viewed at 48 hpf (D) and 72 hpf (E). Arrows in second panel of each indicate swollen epicardial sac. Graphs in (D,E) show average (±s.d.) Feret diameter of eyes and lenses; statistical analyses by Student’s t-tests (48 hpf; n = 22 normal, 7 sih–/–) and Mann-Whitney test (72 hpf; n = 17 normal, 11 sih–/–). (F) Live, normal clutchmates and vlt–/– embryos viewed at 72 hpf. Graph in (F) shows average (±s.d.) Feret diameter of eyes; statistical analysis by Mann-Whitney test (p = 0.068; n = 12 normal, 13 vlt–/–). Scale bar (in (A), applies to all images) = 100 μm. Statistical notation: **p < 0.01; ***p < 0.001. Embryos in (A–E) were PTU-treated to prevent pigmentation from interfering with visualizing the lens.

Acknowledgments
This image is the copyrighted work of the attributed author or publisher, and ZFIN has permission only to display this image to its users. Additional permissions should be obtained from the applicable author or publisher of the image. Full text @ Front Cell Dev Biol