IMAGE

Figure 7

ID
ZDB-IMAGE-210428-19
Source
Figures for Li et al., 2021
Image
Figure Caption

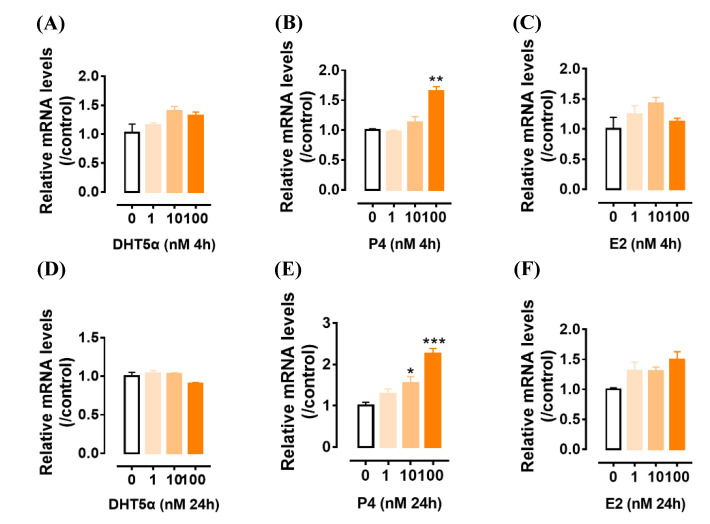
Figure 7

The effects of androgen (DHT5α) (A,D), progesterone (P4) (B,E), and estradiol (E2) (C,F) treatment (0 nM, 1 nM, 10 nM, and 100 nM) for 4 h and 24 h on cGPR12 mRNA expression in cultured granulosa cells from 6–8 mm follicles as detected by qPCR. Each data point represents the mean ± SEM of 4 replicates (N = 4). * p < 0.05; ** p < 0.01; *** p < 0.001 vs. control.

Acknowledgments
This image is the copyrighted work of the attributed author or publisher, and ZFIN has permission only to display this image to its users. Additional permissions should be obtained from the applicable author or publisher of the image. Full text @ Genes (Basel)