
Image
|
Figure Caption
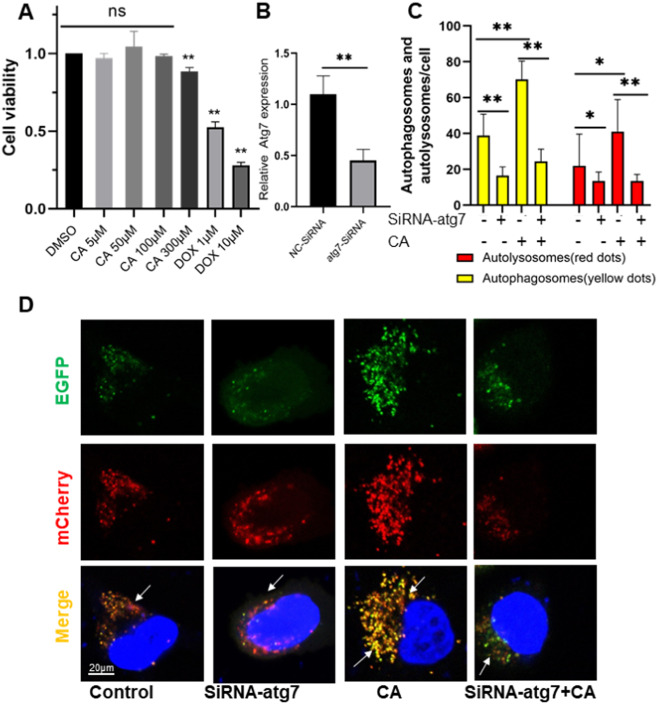
Fig. 4 Effect of CA on cell autophagy. (A) Effects of DOX (1 and 10??M) and CA (5, 50, 100, and 300??M) alone on viability of H9C2 cells at 24?h by MTT assay (n?=?3). (B) Atg7 was confirmed knockdown via RT-PCR in HeLa cells. (C) Quantitative analysis of yellow puncta (autophagosomes) and red puncta (autolysosomes). Data are expressed as mean?�?SD. *P?
Acknowledgments
This image is the copyrighted work of the attributed author or publisher, and
ZFIN has permission only to display this image to its users.
Additional permissions should be obtained from the applicable author or publisher of the image.
Full text @ Biomed. Pharmacother.