Image
Figure Caption
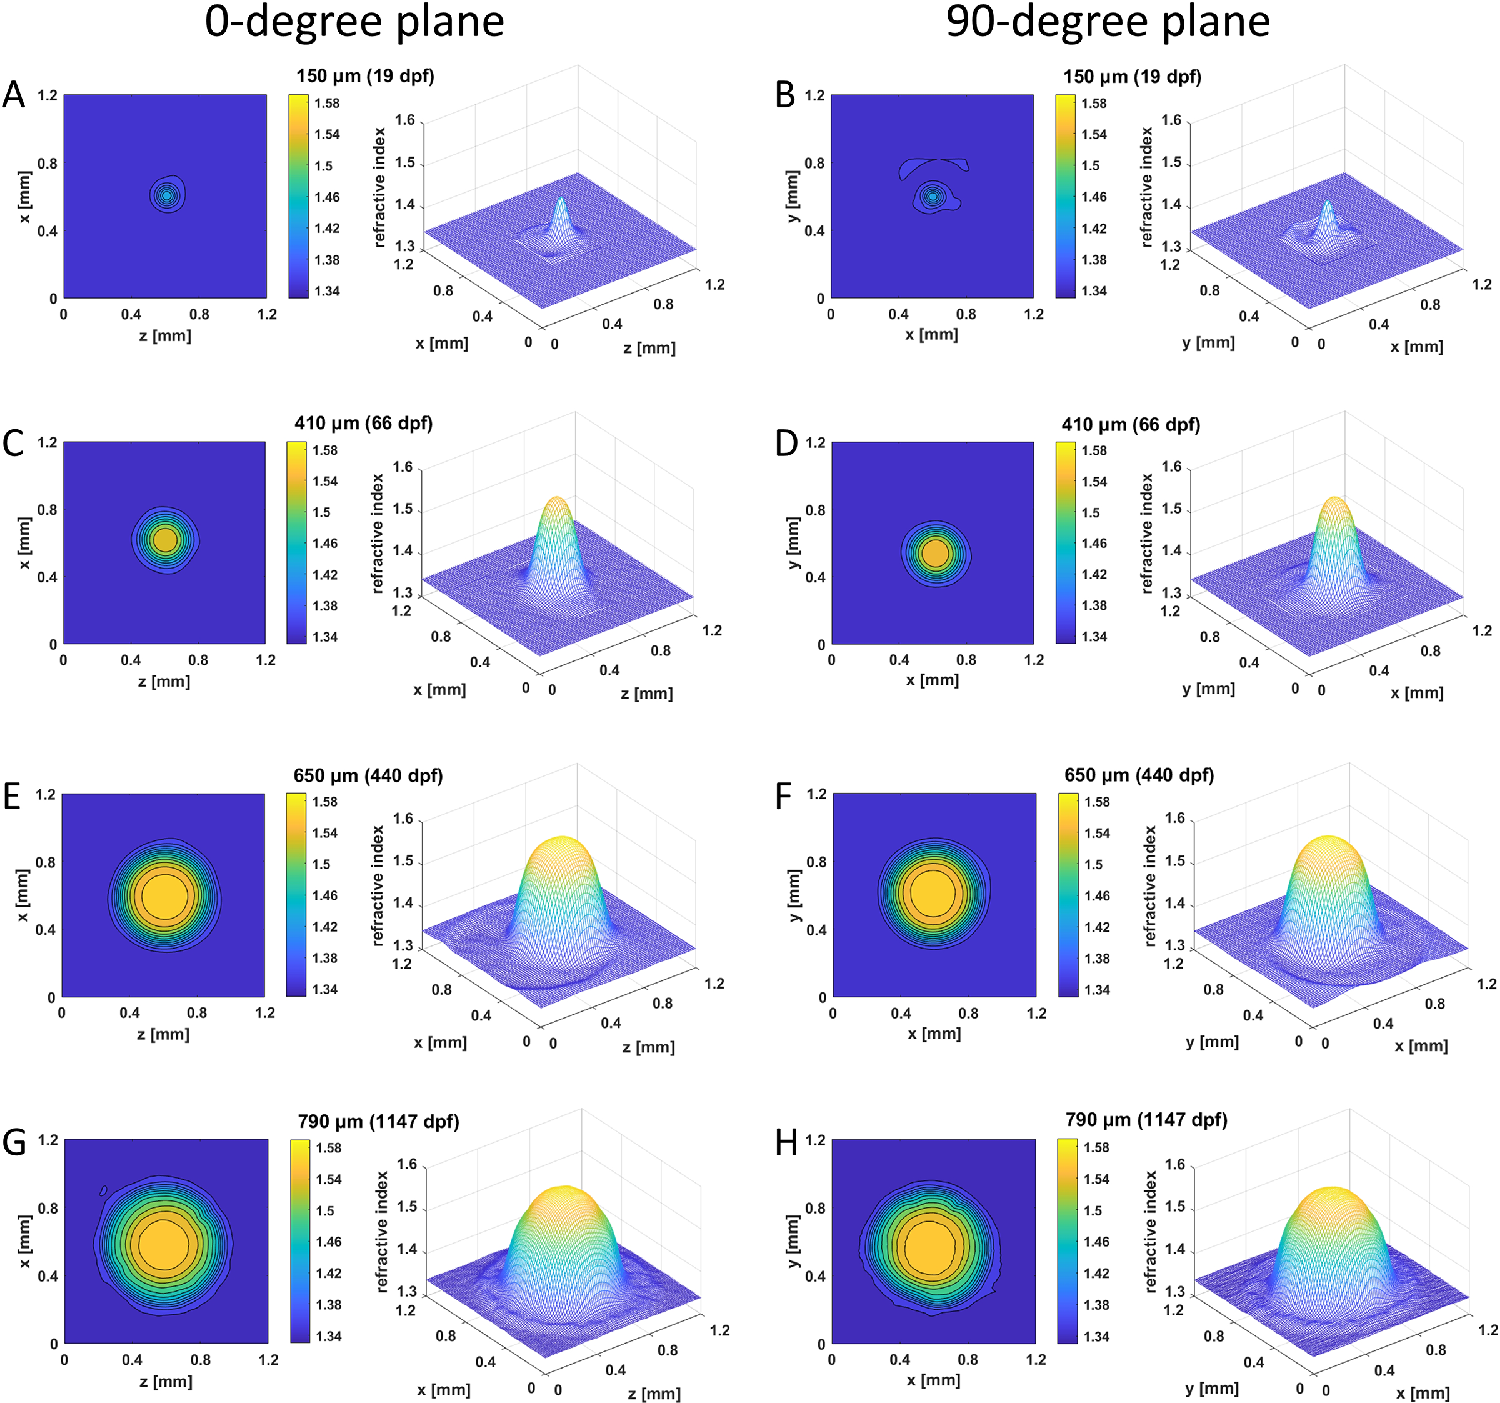
Fig. 3 GRIN distributions in aqp0b?/? lenses. Two-dimensional contour plot (left panels) and 3D mesh plot (right panels) of GRIN distributions in the 0░ plane, representing the equatorial plane (left column), and 90░ plane, representing the axial plane (right column), of four selected lenses with diameters ranging from 130 to 790 Ám at specified dpf. See Supplementary Figure S2 for higher magnifications of A and B.
Figure Data
Acknowledgments
This image is the copyrighted work of the attributed author or publisher, and
ZFIN has permission only to display this image to its users.
Additional permissions should be obtained from the applicable author or publisher of the image.
Full text @ Invest. Ophthalmol. Vis. Sci.

