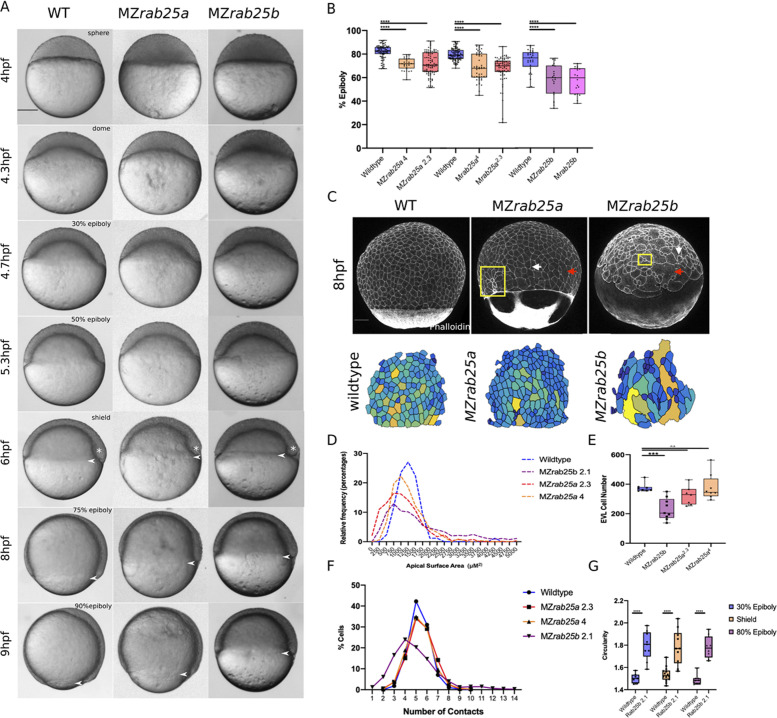
Figure 2 (A) Time-matched bright field images of lateral views of WT, MZrab25a and MZrab25b embryos during epiboly. Arrowheads indicate blastoderm margin, asterisks denote embryonic organizer (shield). (B) Quantification of epiboly progression after 8hpf in: WT (n = 80), MZrab25a (2.3, n = 87), MZrab25a (4,n = 28); WT (n = 97), Mrab25a (2.3,n = 73), MZrab25a (4,n = 49); WT (n = 29), MZrab25b (n = 21), Mrab25b (n = 18). Means: SEM; Two-Way ANOVA; ***p<0.001, ****p<0.0001.(N = 3). (C) Confocal z-projections of time-matched lateral views of WT, MZrab25a and MZrab25b embryos at 8hpf stained with phalloidin and corresponding apical surface area heat maps. Cooler colors represent smaller areas, warmer colors represent larger areas. Yellow boxes indicate cells with reduced apices. Red arrows denote cells with increased apical surface areas. White arrows indicate curved cell junctions. Scale bar 100 ?m. (D) Frequency distribution of apical surface areas of WT (n = 817, N = 8), MZrab25a 2.3 (n = 651, N = 14), MZrab25a 4 (n = 654, N = 15) and MZrab25b (n = 503, N = 15) embryos at 6hpf. (E) EVL Cell number in WT (n = 8), MZrab25b (n = 8), MZrab25a 2.3 (n = 9) and MZrab25a 4 (n = 7) embryos at 6hpf. Means: SEM; Two-Way ANOVA; ***p<0.001. (F) Frequency distributions of EVL cellular contacts number at 6hpf in WT (n = 817, N = 8), MZrab25a 2.3 (n = 651, N = 14), MZrab25a 4 (n = 654, N = 15) and MZrab25b (n = 503, N = 15). (G) Circularity quantifications for WT and MZrab25b embryos during epiboly. 30% epiboly: WT (n = 7), Mrab25b (n=7). Shield: WT (n=14), Mrab25b (n=10). 80% epiboly: WT (n=8), Mrab25b (n=9). Means: SEM: One-way ANOVA, ****p<0.0001.
Image
Figure Caption
Figure Data
Acknowledgments
This image is the copyrighted work of the attributed author or publisher, and
ZFIN has permission only to display this image to its users.
Additional permissions should be obtained from the applicable author or publisher of the image.
Full text @ Elife

