IMAGE

Figure 5

ID
ZDB-IMAGE-210414-33
Source
Figures for Banerji et al., 2021
Image
Figure Caption

Figure 5

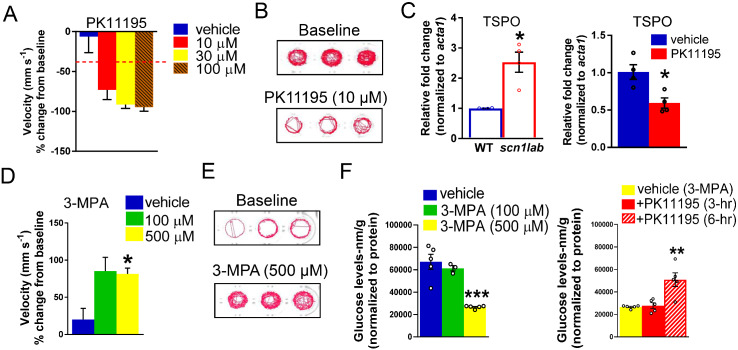
PK11195 is a positive hit in both metabolic and behaviour phenotyping assays. (A) Bar graph representing percent change in mean velocity (mm s−1) in scn1lab mutant larvae (6 dpf) treated with three concentrations of PK11195 (10, 30 and 100 μM) for 3-h. Locomotion was recorded for 10-min in DanioVision system using a locomotion tracking software (EthoVision XT 11.5-Noldus Information Technology). PK11195 at both 10 and 30 μM showed significant decrease in mean velocity. PK11195 at 100 μM was a toxic dose. Data are presented as mean change in velocity ± SEM with n = 36. The cut-off for significant decrease in mean velocity is set at ≥40% (dashed line). (B) Representative traces of locomotion plots obtained from 10-min recordings for baseline and 10 μM PK11195-treated larvae are shown. (C) The bar graph represents qPCR data with increased expression of Tspo mRNA in scn1lab mutants compared to wild-type. The bar graph on the right represents qPCR data with relative fold change of Tspo with 3-h PK11195-treated scn1lab mutants. No significant change was observed; however, a trend of decreased Tspo expression was seen in PK11195-treated scn1lab mutants. Data were normalized to the housekeeping gene acta1 and presented as mean ± S.E.M. Statistics were performed by Student’s unpaired t-test. Asterisks (*) indicate a significance *P < 0.05. Values represent averages from n = 3, where each sample represents 10–12 pooled 6-dpf larvae. (D) The bar graph represents increased swim behaviour in 5-dpf wild-type larvae treated with 500 μM 3-MPA. No increase in swim behaviour was observed with 100 μM 3-MPA (n = 24). WT refers to wild-type larvae. (E) Representative traces of locomotion plots obtained from 10-min recordings for baseline and 500 µM 3-MPA-treated wild-type larvae are shown. (F) Representative bar graph showing glucose levels (normalized to total protein) in 3-MPA-treated wild-type larvae. A significant decrease of glucose levels was observed in 3-MPA-treated larvae (3- and 6-h) when compared with vehicle (wild-type untreated larvae). The bar graph in the right-hand side represents glucose levels in PK11195-treated larvae. A significant increase of glucose levels was observed in larvae that were incubated with 3-MPA (500 μM) and PK11195 (10 μM) for 6-h but not for 3-h compared with vehicle (3-MPA-treated larvae). Data are presented as mean ± SEM. Statistics were performed by two-way ANOVA followed by Tukey’s multiple comparison test with significance taken as **P <0.01, ***P <0.001 and ****P <0.0001. Values represent averages for n = 5, where each sample represents 20 pooled larvae.

Acknowledgments
This image is the copyrighted work of the attributed author or publisher, and ZFIN has permission only to display this image to its users. Additional permissions should be obtained from the applicable author or publisher of the image. Full text @ Brain Commun