
Image
|
Figure Caption
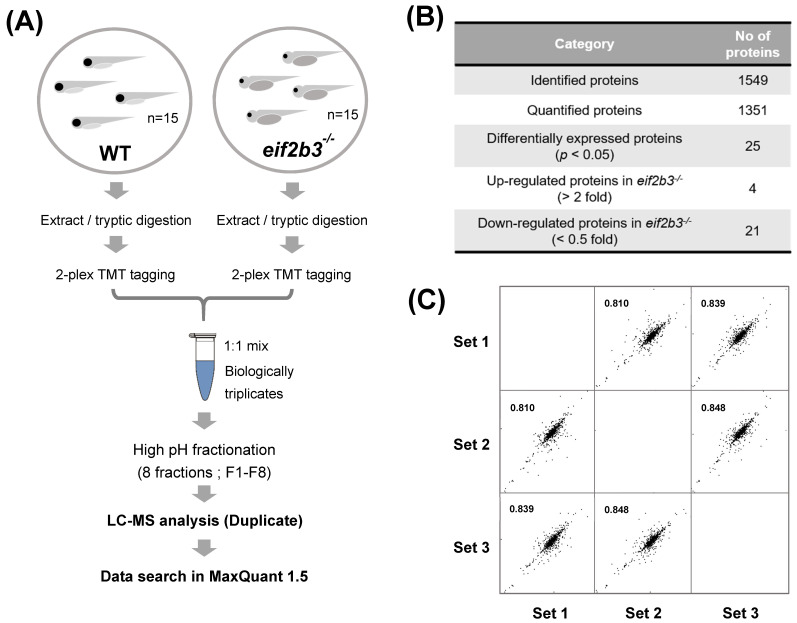
Figure 2 Workflow for comparative proteome analysis in an eif2b3 knockout. (A) Flowchart illustrating the experimental procedure for quantification of regulated proteins in the eif2b3?/? model. (B) The table showing the number of proteins identified in WT and eif2b3?/? model, respectively. (C) Highly correlated results of triplicate analyses.
Acknowledgments
This image is the copyrighted work of the attributed author or publisher, and
ZFIN has permission only to display this image to its users.
Additional permissions should be obtained from the applicable author or publisher of the image.
Full text @ Int. J. Mol. Sci.