IMAGE

Fig. 7.

ID
ZDB-IMAGE-210403-42
Source
Figures for Postlethwait et al., 2021
Image
Figure Caption

Fig. 7.

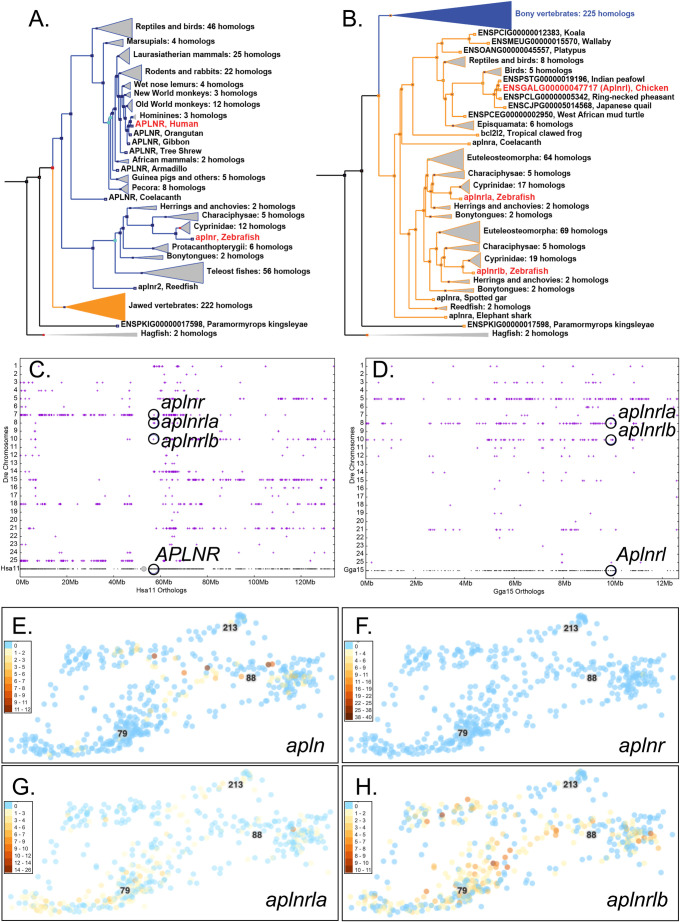
Genomics and expression of Apelin and its receptors. (A) Phylogenetic tree (ENSGT01000000214406) with the APLNR/’aplnr2’ (suggested new name aplnr, ENSDARG00000004447) subtree (blue in panel B) expanded. (B) The same tree with the ‘aplnra’/’aplnrb’ (suggested new name aplnrla, ENSDARG00000002172)/aplnrlb (ENSDARG00000036670) subtree (orange in panel A) expanded. (C) A dot plot representing orthologs and paralogs of Hsa11 genes versus zebrafish (Dre) chromosomes plotted directly above the location of each Hsa11 gene showing extensive conservation with Dre7, the site of aplnr, but not Dre8 or Dre10, the locations of aplnrla and aplnrlb, respectively. (D) A dot plot of chicken chromosome Gga15 versus zebrafish chromosomes showing the sites of aplnrla and aplnrlb and their ortholog in chicken (Aplnrl, ENSGALG00000047717) identified in the tree in B. (E-H) Expression of apln, aplnr, aplnrla, and aplnrlb in endothelial cells.

Acknowledgments
This image is the copyrighted work of the attributed author or publisher, and ZFIN has permission only to display this image to its users. Additional permissions should be obtained from the applicable author or publisher of the image. Full text @ Biol. Open