IMAGE

Fig. 2

ID
ZDB-IMAGE-210328-2
Source
Figures for Dong et al., 2021
Image
Figure Caption

Fig. 2

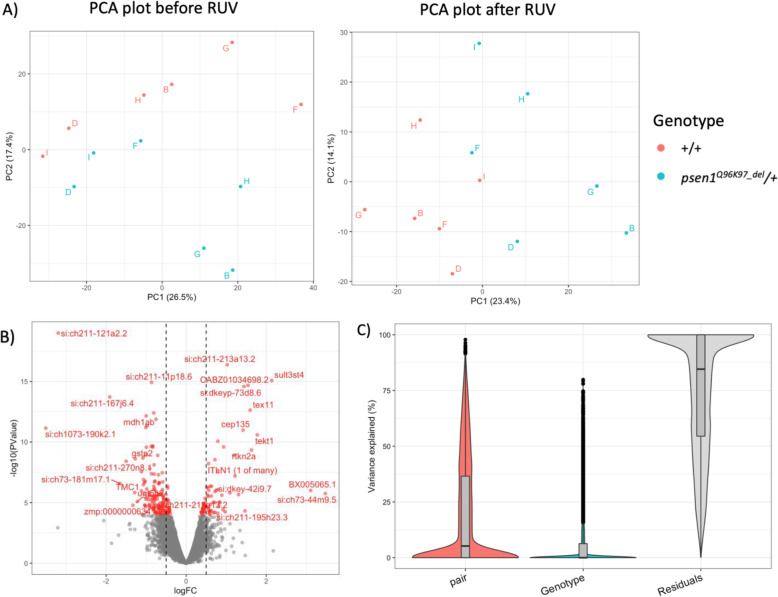
a PCA plots before (left) and after (right) RUV treatment, showing the separation between wild type and mutant larvae across principle components PC1 and PC2. Each sample is labelled by pair (i.e. B, D, F, G, H, or I). b A volcano plot highlighting identified DE genes in red. The DE genes with absolute log2FC > ±1.2 are labelled on the plot. The black vertical lines indicate absolute log2FC = ±0.5. c A plot of percent variation summarizing the contribution of each variable

Acknowledgments
This image is the copyrighted work of the attributed author or publisher, and ZFIN has permission only to display this image to its users. Additional permissions should be obtained from the applicable author or publisher of the image. Full text @ BMC Genomics