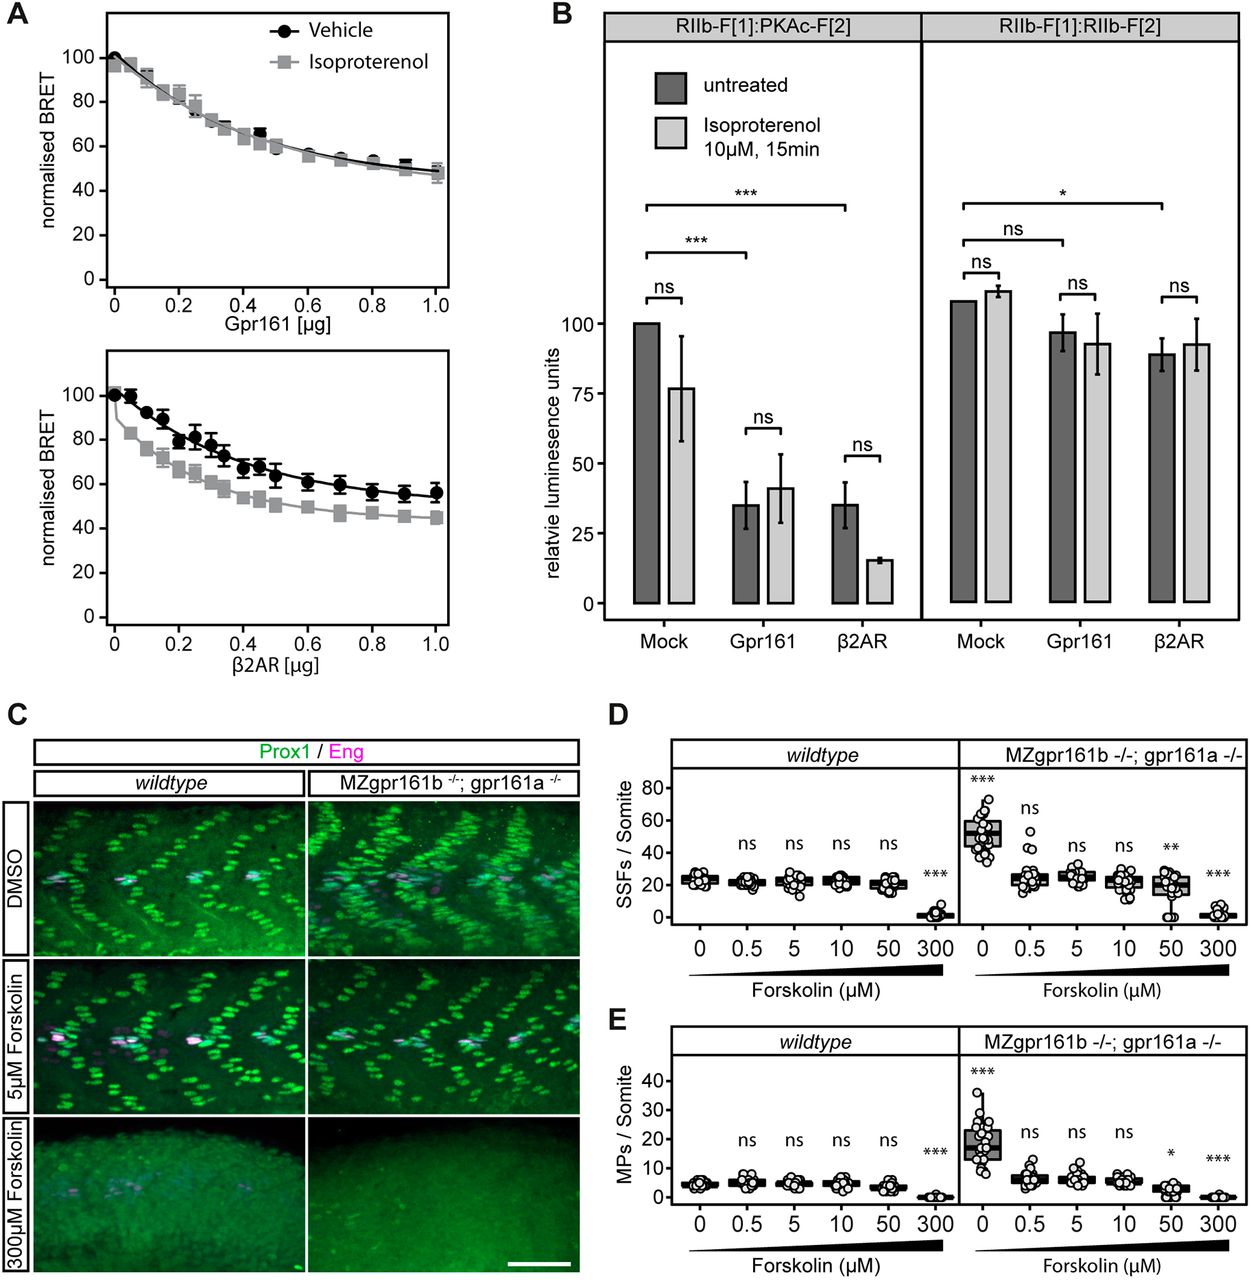
Fig. 4 cAMP elevation rescues the gpr161 phenotype. (A) The reporter constructs, together with increasing concentrations of ?2AR (positive control) and Gpr161 receptor constructs, were transiently expressed in HEK293 cells followed by treatment with the ?2AR-specific agonist isoproterenol (10?µM, 15?min). BRET readout was measured using the Mithras LB 940 plate reader (±s.d. of n=4 independent experiments), and normalised to the 0?µg receptor transfection experiments. (B) IMCD3 cells were transiently transfected with the constructs for the PKAc:RIIb RLuc PCA combination to assess PKA activation in response to Gpr161 and ?2AR expression, and stimulation by isoproterenol (10?µM for 15?min). RIIb-F1/RIIb-F2 RLuc PCA constructs were used as a negative control. The readouts were normalised to untreated 0?µg receptor transfection experiments (±s.d. of n=3 independent experiments; ***P<0.001, *P<0.05; ns, not significant; two-way ANOVA, Tukey's post-hoc test for pairwise comparisons). (C) Prox1 (green)/Eng (purple) immunostaining of wild-type and MZgpr161b?/?; gpr161a?/? embryos treated with increasing concentrations of forskolin. Scale bar: 50?µm. (D,E) Quantification of SSFs and MPs in wild-type and MZgpr161b?/?; gpr161a?/? embryos treated with increasing concentrations of forskolin (for each experiment, n=27 somites in nine embryos; ***P<0.001, **P<0.01, *P<0.05; ns, not significant; two-way ANOVA, Tukey's post-hoc test for pairwise comparisons). Box plots show median values (centre lines) and the interquartile ranges (boxes); whiskers extend to the highest and lowest values within 1.5×IQR (inter-quartile range).
Image
Figure Caption
Figure Data
Acknowledgments
This image is the copyrighted work of the attributed author or publisher, and
ZFIN has permission only to display this image to its users.
Additional permissions should be obtained from the applicable author or publisher of the image.
Full text @ Development

