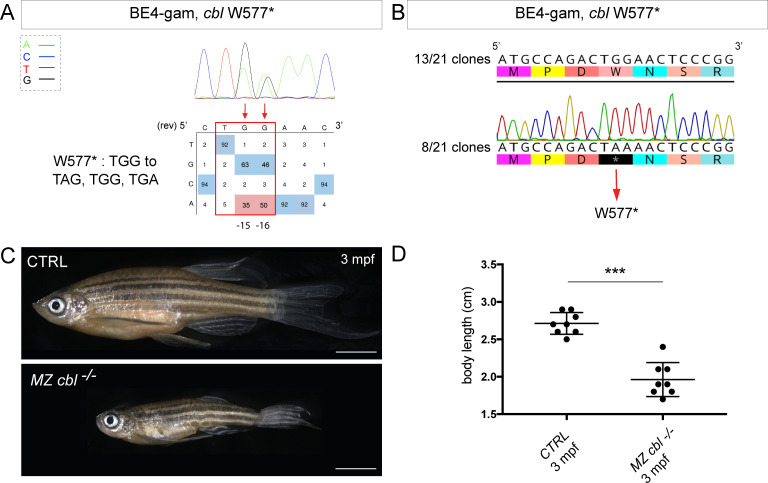
Figure 3. (A) DNA sequencing chromatogram of targeted cbl gene with the BE4-gam. W577* mutation in Cbl upon C-to-T conversion in cbl reached 50% for the C16 base and 35% for the C15 base of gene-editing efficiency. The chromatogram refers to the efficiency reported for the embryo provided in the first column of Table 2. The numbers in the boxes represent the percentage of each base at that sequence position. In red are highlighted the base substitutions introduced by base editing, while the original sequence is in blue. The color code of the chromatogram is indicated in the upper left corner (Adenine green, Cytosine blue, Thymine red, and Guanine black). The distance from the PAM sequence of the targeted C base is indicated below the chromatogram. It is considered that the quantifications under 5% are due to the background signal from Sanger sequencing and are thus non-significant (Kluesner et al., 2018). (B) Sequencing of individual clones of a pool of F1 embryos from a founder carrying the W577* mutation in Cbl. TGG-to-TAA precise mutation was found in 8 of 21 clones. No editing or INDELs were detected in all other clones. (C) Three months post-fertilization (mpf) cbl wild type derived from the incross of wild-type siblings (upper panel) and dwarf maternal zygotic (MZ) mutant fish found in 24% of the progeny (lower panel). (D) Quantification of the body length of the cbl+/+ controls and of the dwarf MZ cbl−/−. The dwarf fish show a significant reduced size at three mpf compared to the wild-type controls. n = 8 for each group. Mann–Whitney test, p=0,0002. Scale bars: (C) 5 mm.
Image
Figure Caption
Figure Data
Acknowledgments
This image is the copyrighted work of the attributed author or publisher, and
ZFIN has permission only to display this image to its users.
Additional permissions should be obtained from the applicable author or publisher of the image.
Full text @ Elife

