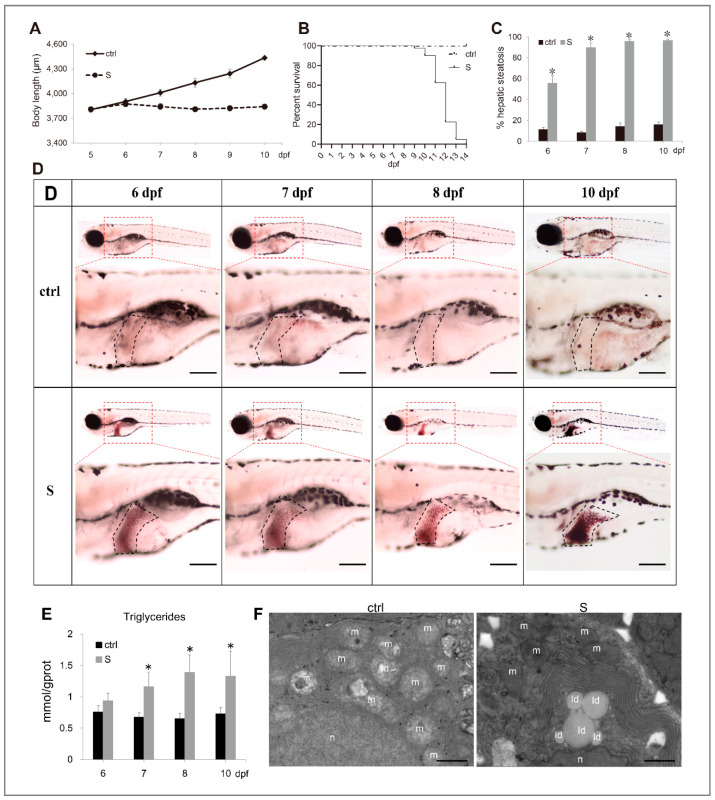
Figure 1 Characterization of starvation-induced hepatic steatosis in zebrafish larvae. (A) The depiction of growth performance in the control and starved larvae from 5 to 10 dpf. (B) The survival curve of the control and starved larvae was depicted by Kaplan-Meier assay. (C) Percentages of control and starved larvae with hepatic steatosis at 6, 7, 8, and 10 dpf. (D) Representative images of whole-mount Oil Red O (ORO) staining labelled the neutral lipids in larval liver at 6, 7, 8, and 10 dpf. The black dotted box labels the liver of zebrafish larvae. Bars = 200 ?m. (E) Hepatic triacylglycerol (TAG) levels in the control and starved larvae from 6 to 10 dpf were determined. (F) Electron micrographs of hepatocytes from the control and starved larvae. Id: lipid droplets; m: mitochondria; n: cell nucleus. Bars = 10 ?m. * indicates significant differences (p < 0.05).
Image
Figure Caption
Figure Data
Acknowledgments
This image is the copyrighted work of the attributed author or publisher, and
ZFIN has permission only to display this image to its users.
Additional permissions should be obtained from the applicable author or publisher of the image.
Full text @ Biology (Basel)

