IMAGE

Fig. 4

ID
ZDB-IMAGE-210227-5
Source
Figures for Crespo et al., 2021
Image
Figure Caption

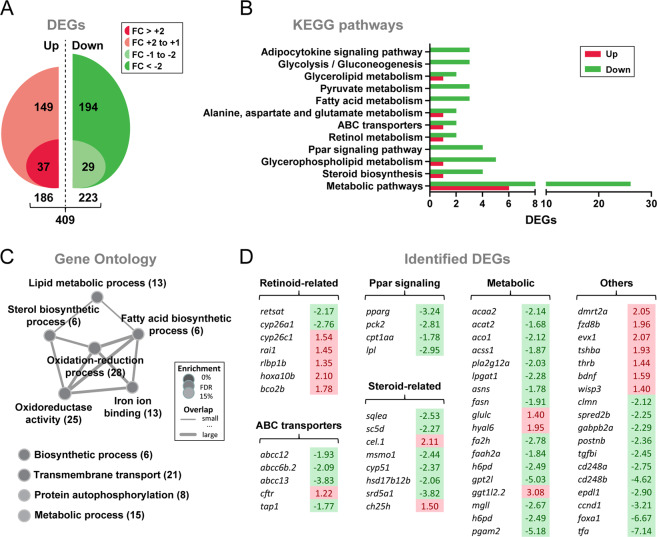
Fig. 4 Gene expression profiling of testis tissue in response to Insl3.

A Total numbers of up-regulated and down-regulated genes (DEGs) identified by RNAseq (N = 3; p < 0.05). To generate testis samples for RNAseq, male zebrafish testes were incubated in the absence or presence of zebrafish Insl3 (100 ng/mL) for 2 days. FC fold change. B, C Insl3-regulated KEGG pathways (B) and Gene Ontology terms (C) in adult zebrafish testis tissue. KEGG pathways represented by at least three DEGs and ratio of regulated genes (down-regulated/up-regulated) higher than 2 were considered for the analysis. In C, number of identified genes is shown in brackets and enrichment significance (FDR, false discovery rate) is represented as a color gradient. D Selected DEGs identified by KEGG and GO analyses grouped by their function. Fold change values are shown with a red or green background indicating up-regulation or down-regulation, respectively.

Acknowledgments
This image is the copyrighted work of the attributed author or publisher, and ZFIN has permission only to display this image to its users. Additional permissions should be obtained from the applicable author or publisher of the image. Full text @ Commun Biol