
|
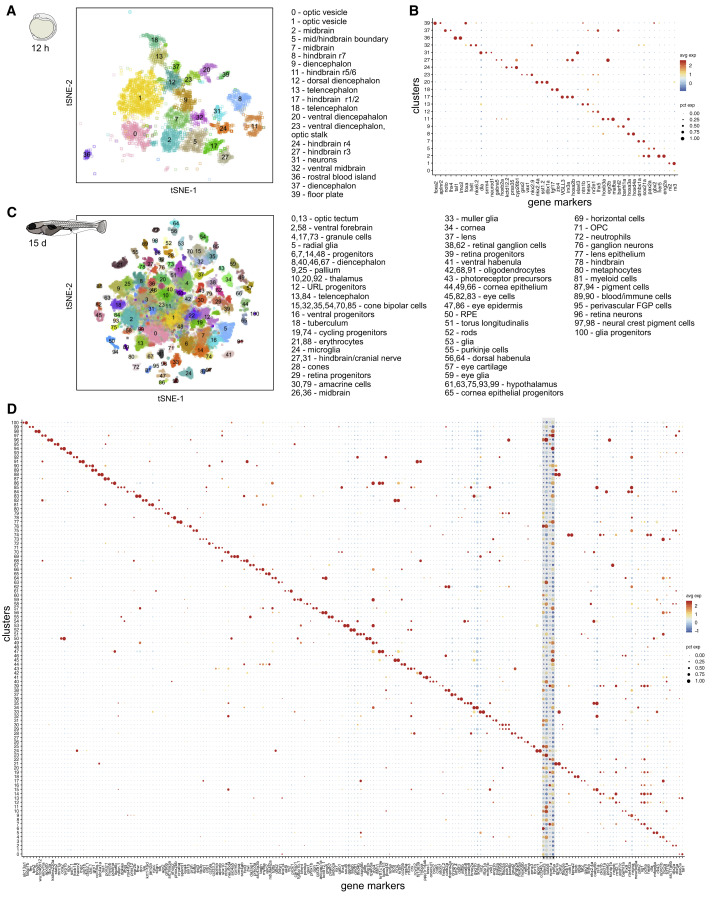
Fig. 2 Figure 2. Brain Cell Type Diversification from 12 hpf to 15 dpf (A) tSNE plot of 12 hpf dataset. Only clusters corresponding to neural and blood cell types are shown. Inferred identities of each cluster are described. (B) Dot plot of gene expression pattern of select marker genes (columns) for each cluster (row). Dot size indicates the percentage of cells expressing the marker; color represents the average scaled expression level. (C) tSNE plot of 15 dpf dataset. Inferred identities of each cluster are described. (D) Dot plot of gene expression patterns of select marker genes for each cluster. Layout is same as (B). Grey box represents generic neuronal and progenitor genes. tSNE implementations: Barnes-Hut (A), Fourier transform (C)