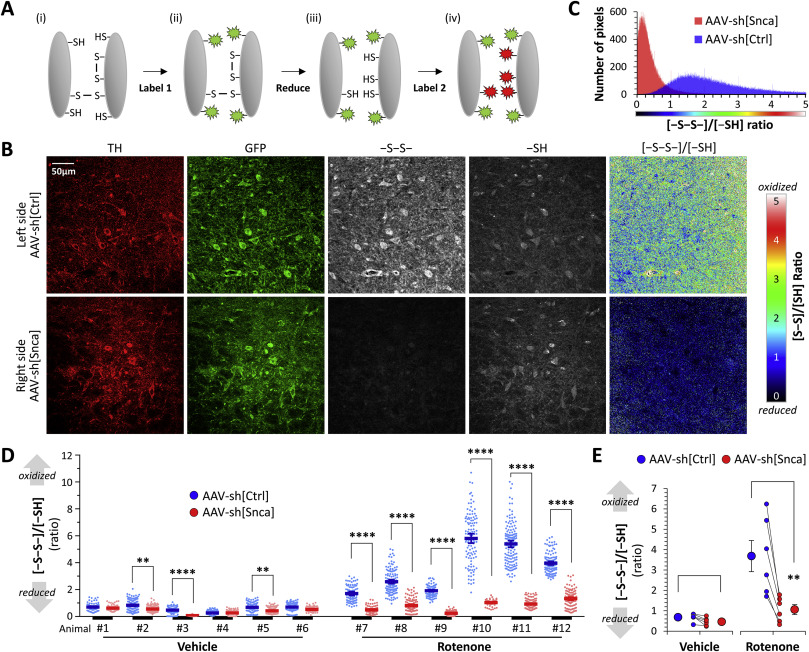
Fig. 2 Fig. 2. ?-Synuclein knockdown mitigates rotenone-induced thiol oxidation in dopaminergic neurons in vivo. A: Schematic illustration of the thiol histochemical method used in panels B?E. Reduced thiol groups were irreversibly labeled with a maleimide-conjugate fluorophore. Disulfide bonds were then reduced and the resulting newly-generated thiols labeled with maleimide conjugated to a second fluorophore. The relative signal intensity of the two fluorophores was determined by confocal microscopy, providing a map of thiol oxidation in the tissue sample. B: Confocal micrographs of a midbrain section from a rat that received AAV-sh[Ctrl] in the left substantia nigra (top row) and AAV-sh[Snca] in the right substantial nigra (bottom row), followed by 6 days of rotenone (see Fig. 1A). The images show: immunofluorescence for tyrosine hydroxylase (TH; red); immunofluorescence for GFP (green); oxidized thiols (-S-S-; grayscale); reduced thiols (-SH; grayscale). The final column shows the ratiometric image for oxidized/reduced thiols, pseudocolored according to the scale shown to the right of the panel. C: Histogram showing the frequency distribution of the oxidized/reduced thiol ratio in each pixel of the images shown in panel B. D: Scatterplots showing thiol oxidation, analyzed in dopaminergic neurons on both the left (AAV-sh[Ctrl]; blue) and right (AAV-sh[Snca]; red) sides of the substantia nigra in 6 vehicle (animals #1 - #6) and 6 rotenone (animals #7 - #12) treated rats. Data points show the mean oxidized/reduced thiol ratio in individual dopaminergic neurons, bars show mean ± SE for each side of each animal. p <**0.01, ****0.0001, left vs. right, 1-way ANOVA with Tukey multiple comparisons test. E: Mean dopaminergic neuron thiol oxidation is shown for the two sides of the midbrain in each animal (small markers; the two sides of each animal are connected by a line) alongside mean ± SE for all six animals in each group (large markers). p < 0.01**, left vs. right, 2-tailed paired t-test.
Image
Figure Caption
Acknowledgments
This image is the copyrighted work of the attributed author or publisher, and
ZFIN has permission only to display this image to its users.
Additional permissions should be obtained from the applicable author or publisher of the image.
Full text @ Redox Biol.

