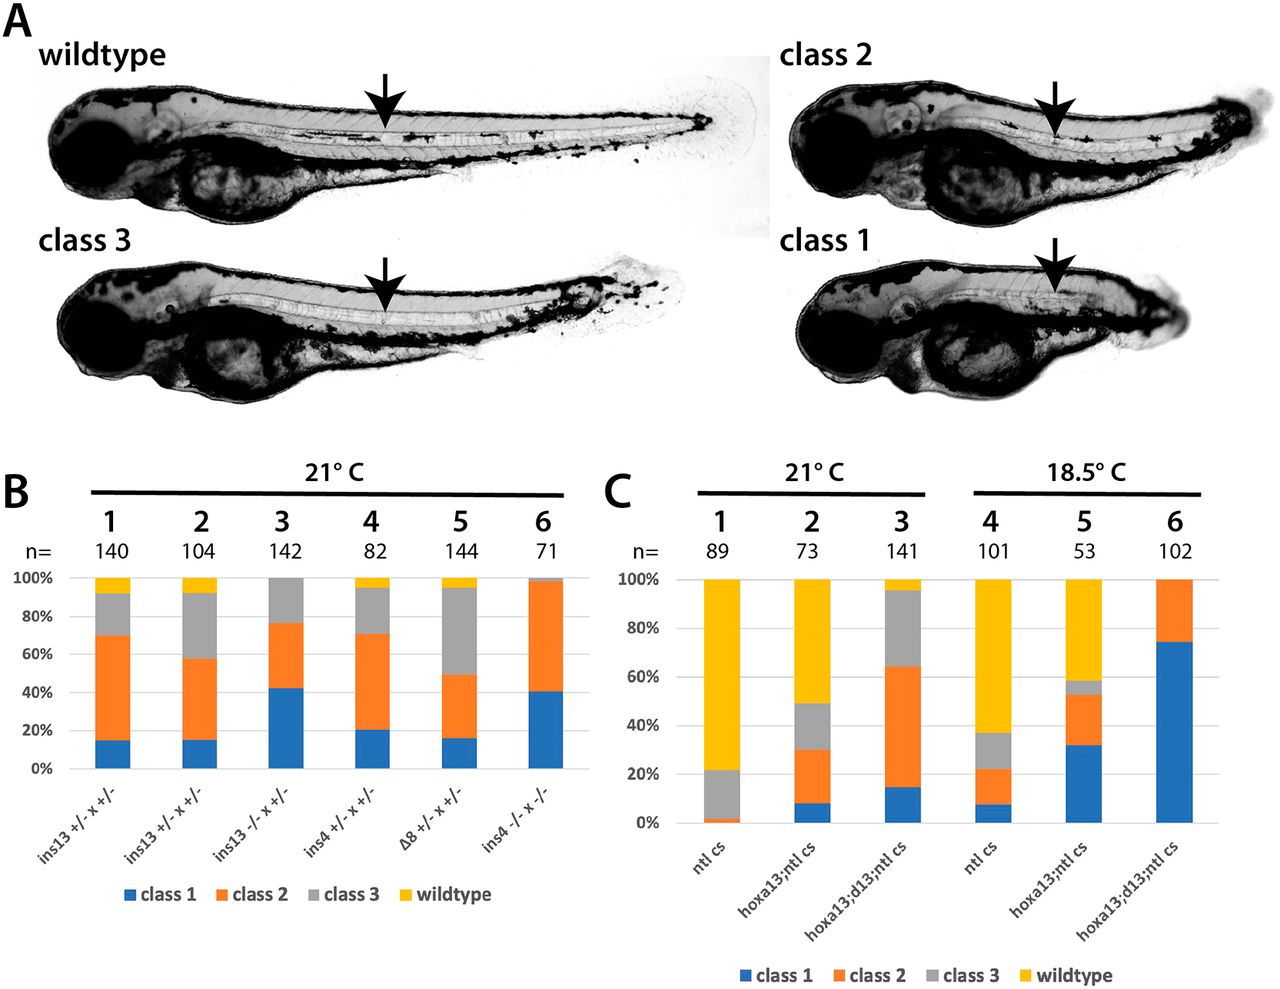
Fig. 3 Interaction between the Hox13 genes and tbxta/ntl. (A) Classification used to score embryos at 3?dpf. The strongest class, class 1, has the same phenotype as tbxta/ntl mutants. Class 2 mutants have a clearly truncated axis, and extend beyond the anus at the end of the yolk tube. Class 3 mutants have relatively minor posterior defects. All classes of embryos have a notochord (arrow). (B) Embryos raised from different crosses that were placed at 21°C at shield stage and scored at 3?dpf. The specific hoxd13a mutation is shown; all fish were homozygous for both hoxa13b?16 and ntlcs. The embryos shown in columns 1 and 2 are from two separate families with the same genotype. (C) Embryos raised from different crosses that were placed at 21°C or 18.5°C at shield stage and scored at 3?dpf. The labels for each column refer to the adults used in the cross: ntl cs, homozygous for ntlcs; hoxa13;ntl cs, homozygous for both hoxa13b?16 and ntlcs; hoxa13;d13;ntl cs, homozygous for both hoxa13b?16 and ntlcs, and heterozygous for hoxd13ains13.
Image
Figure Caption
Figure Data
Acknowledgments
This image is the copyrighted work of the attributed author or publisher, and
ZFIN has permission only to display this image to its users.
Additional permissions should be obtained from the applicable author or publisher of the image.
Full text @ Development

