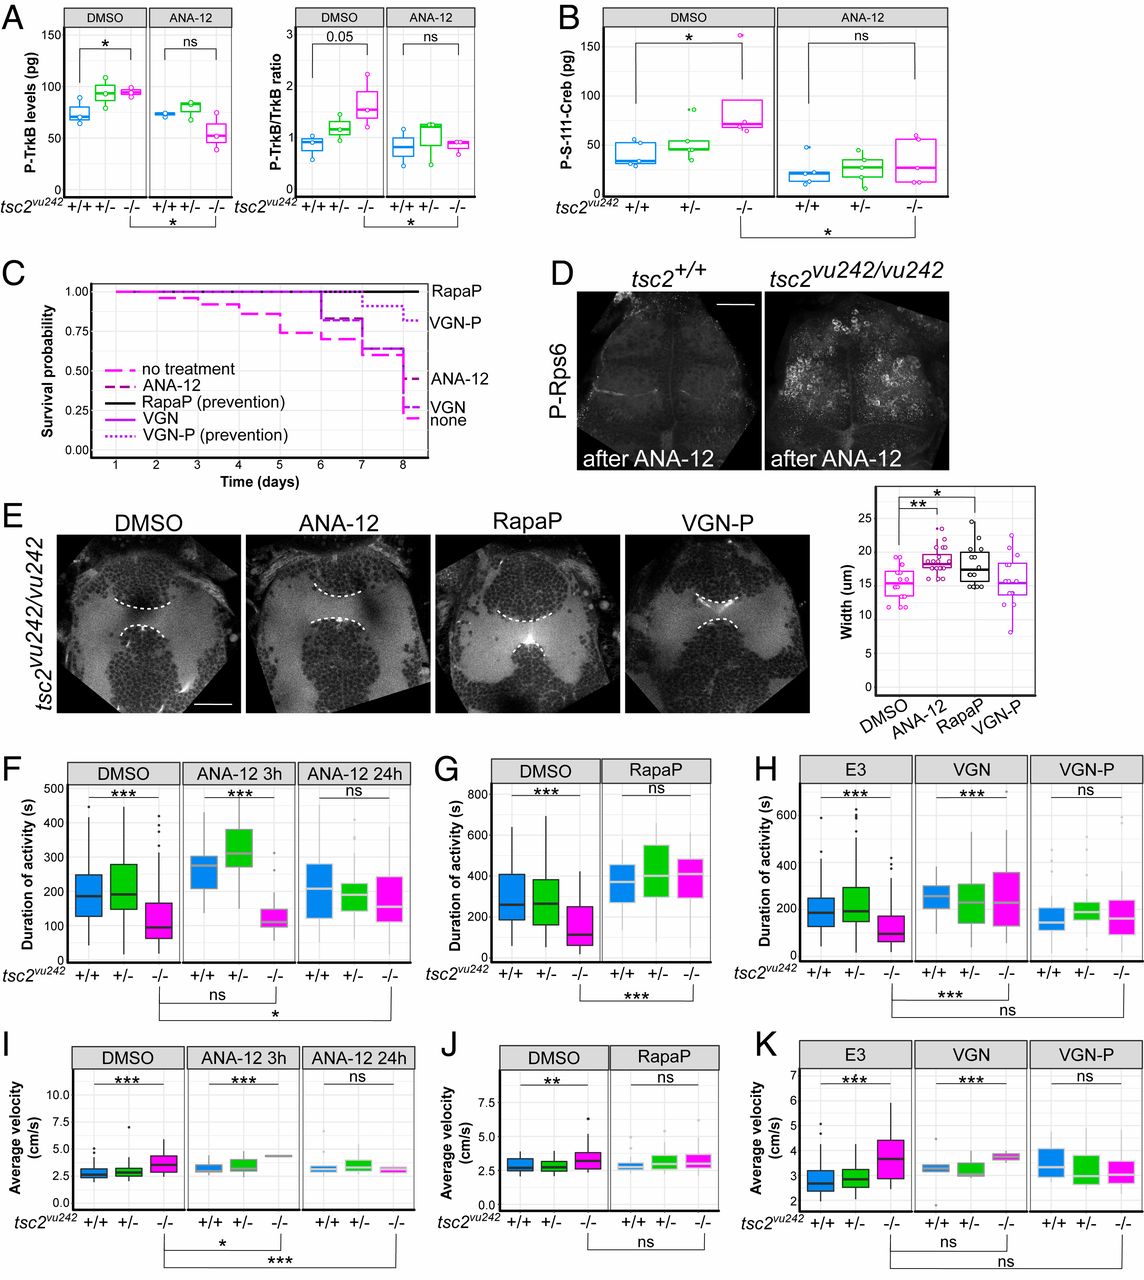
Fig. 5 ANA-12 rescues survival, brain dysconnectivity, impairment in locomotion, and anxiety-related hypervelocity in tsc2vu242vu/242 mutants. (A) Quantification of activation of TrkB receptor judged by levels of P-TrkB and ratio of P-TrkB to TrkB by immunochemistry (ELISA) revealed higher activation levels in tsc2vu242/vu242 fish compared with control siblings and a decrease after ANA-12 treatment [P-TrkB: H = 4.355, P = 0.049; P = 0.05, tsc2vu242/vu242 vs. tsc2+/+ (Dunn’s test)]; P = 0.015, tsc2vu242/vu242 untreated vs. treated with ANA-12 (Dunn’s test); P-TrkB/TrkB: H = 5.689, P = 0.05; P = 0.05, tsc2vu242/vu242 vs. tsc2+/+ (Dunn’s test); P = 0.049, tsc2vu242/vu242 untreated vs. treated with ANA-12 (Dunn’s test)]. (B) Quantification of levels of Creb phosphorylation by immunochemistry (ELISA) revealed higher levels in tsc2vu242/vu242 compared with controls and a decrease after ANA-12 treatment [genotype: F = 3.513, P = 4.66 × 10⁻⁴; treatment: F = 14.759, P = 8.33 × 10⁻⁴; genotype × treatment: P > 0.05; P = 0.012, tsc2vu242/vu242 after ANA-12 vs. DMSO treatment (Tukey HSD test); P = 0.033, untreated tsc2vu242/vu242 vs. tsc2+/+ (Tukey HSD test)]. (C) Survival probability of tsc2vu242/vu242 after various treatments. (D) Confocal images of tsc2vu242 brains that were immunostained with anti–P-Rps6 antibody after ANA-12 treatment. (Scale bar, 30 µm.) (E) AC width in tsc2vu242/vu242 after various treatments, including representative confocal images and quantification [F = 5.83, P = 0.00142; P = 0.002 for DMSO vs. ANA-12, P = 0.049 for DMSO vs. Rapa pretreatment (Dunnett’s test)]. (Scale bar, 30 µm.) (F) Cumulative activity of tsc2vu242/vu242 after treatment with ANA-12 compared with tsc2vu242/+ and tsc2+/+ fish over 1 h of tracking, showing an increase in activity of mutant fish after treatment [H = 16.652, P = 2.42 × 10⁻⁴; P = 0.0172, tsc2vu242/vu242 untreated vs. treated with ANA-12 for 24 h (Dunn’s test)]. (G) Cumulative activity of the tsc2vu242/vu242 after the prevention of disease development by Rapa pretreatment compared with tsc2vu242/+ and tsc2+/+ fish over 1 h of tracking, showing an increase in activity of mutant fish after treatment [H = 32.18, P = 3.9 × 10⁻⁸; P = 2.0 × 10⁻⁸ for tsc2vu242/vu242 untreated vs. rapamycin pretreatment (Dunn’s test)]. (H) Cumulative activity of tsc2vu242/vu242 after the treatment with VGN or VGN-P to prevent disease development, respectively, compared with tsc2vu242/+ and tsc2+/+ fish over 1 h of tracking, showing improvements in activity after short VGN treatment but toxicity after longer treatment with VGN [H = 19.262, P = 6.566 × 10⁻⁵; P = 3.4 × 10⁻⁵ for tsc2vu242/vu242 untreated vs. treated with VGN, P > 0.05 for tsc2vu242/vu242 untreated vs. VGN-P (Dunn’s test)]. (I) Average velocity of high-velocity movements of tsc2vu242/vu242 compared with tsc2vu242/+ and tsc2+/+ fish after treatment with ANA-12 [H = 14.686, P = 6.47 × 10⁻⁴; P = 0.015 for tsc2vu242/vu242 untreated vs. treated with ANA-12 for 3 h, P = 0.003 for tsc2vu242/vu242 untreated vs. treated with ANA-12 for 24 h (Dunn’s test)]. (J) Average velocity of high-velocity movements of tsc2vu242/vu242 fish after the prevention of disease development with Rapa pretreatment compared with tsc2vu242/+ and tsc2+/+ fish [H = 29.68, P = 4.52 × 10⁻⁵; P > 0.05 for tsc2vu242/vu242 untreated vs. tsc2vu242/vu242 with Rapa pretreatment (Dunn’s test)]. (K) Average velocity of high-velocity movements of tsc2vu242/vu242 after the treatment with VGN or VGN-P to prevent disease development, respectively, compared with tsc2vu242/+ and tsc2+/+ fish (H = 3.286, P = 0.19). *P < 0.05, **P < 0.01, ***P < 0.005, ns: not significant.
Image
Figure Caption
Figure Data
Acknowledgments
This image is the copyrighted work of the attributed author or publisher, and
ZFIN has permission only to display this image to its users.
Additional permissions should be obtained from the applicable author or publisher of the image.
Full text @ Proc. Natl. Acad. Sci. USA

