
Image
|
Figure Caption
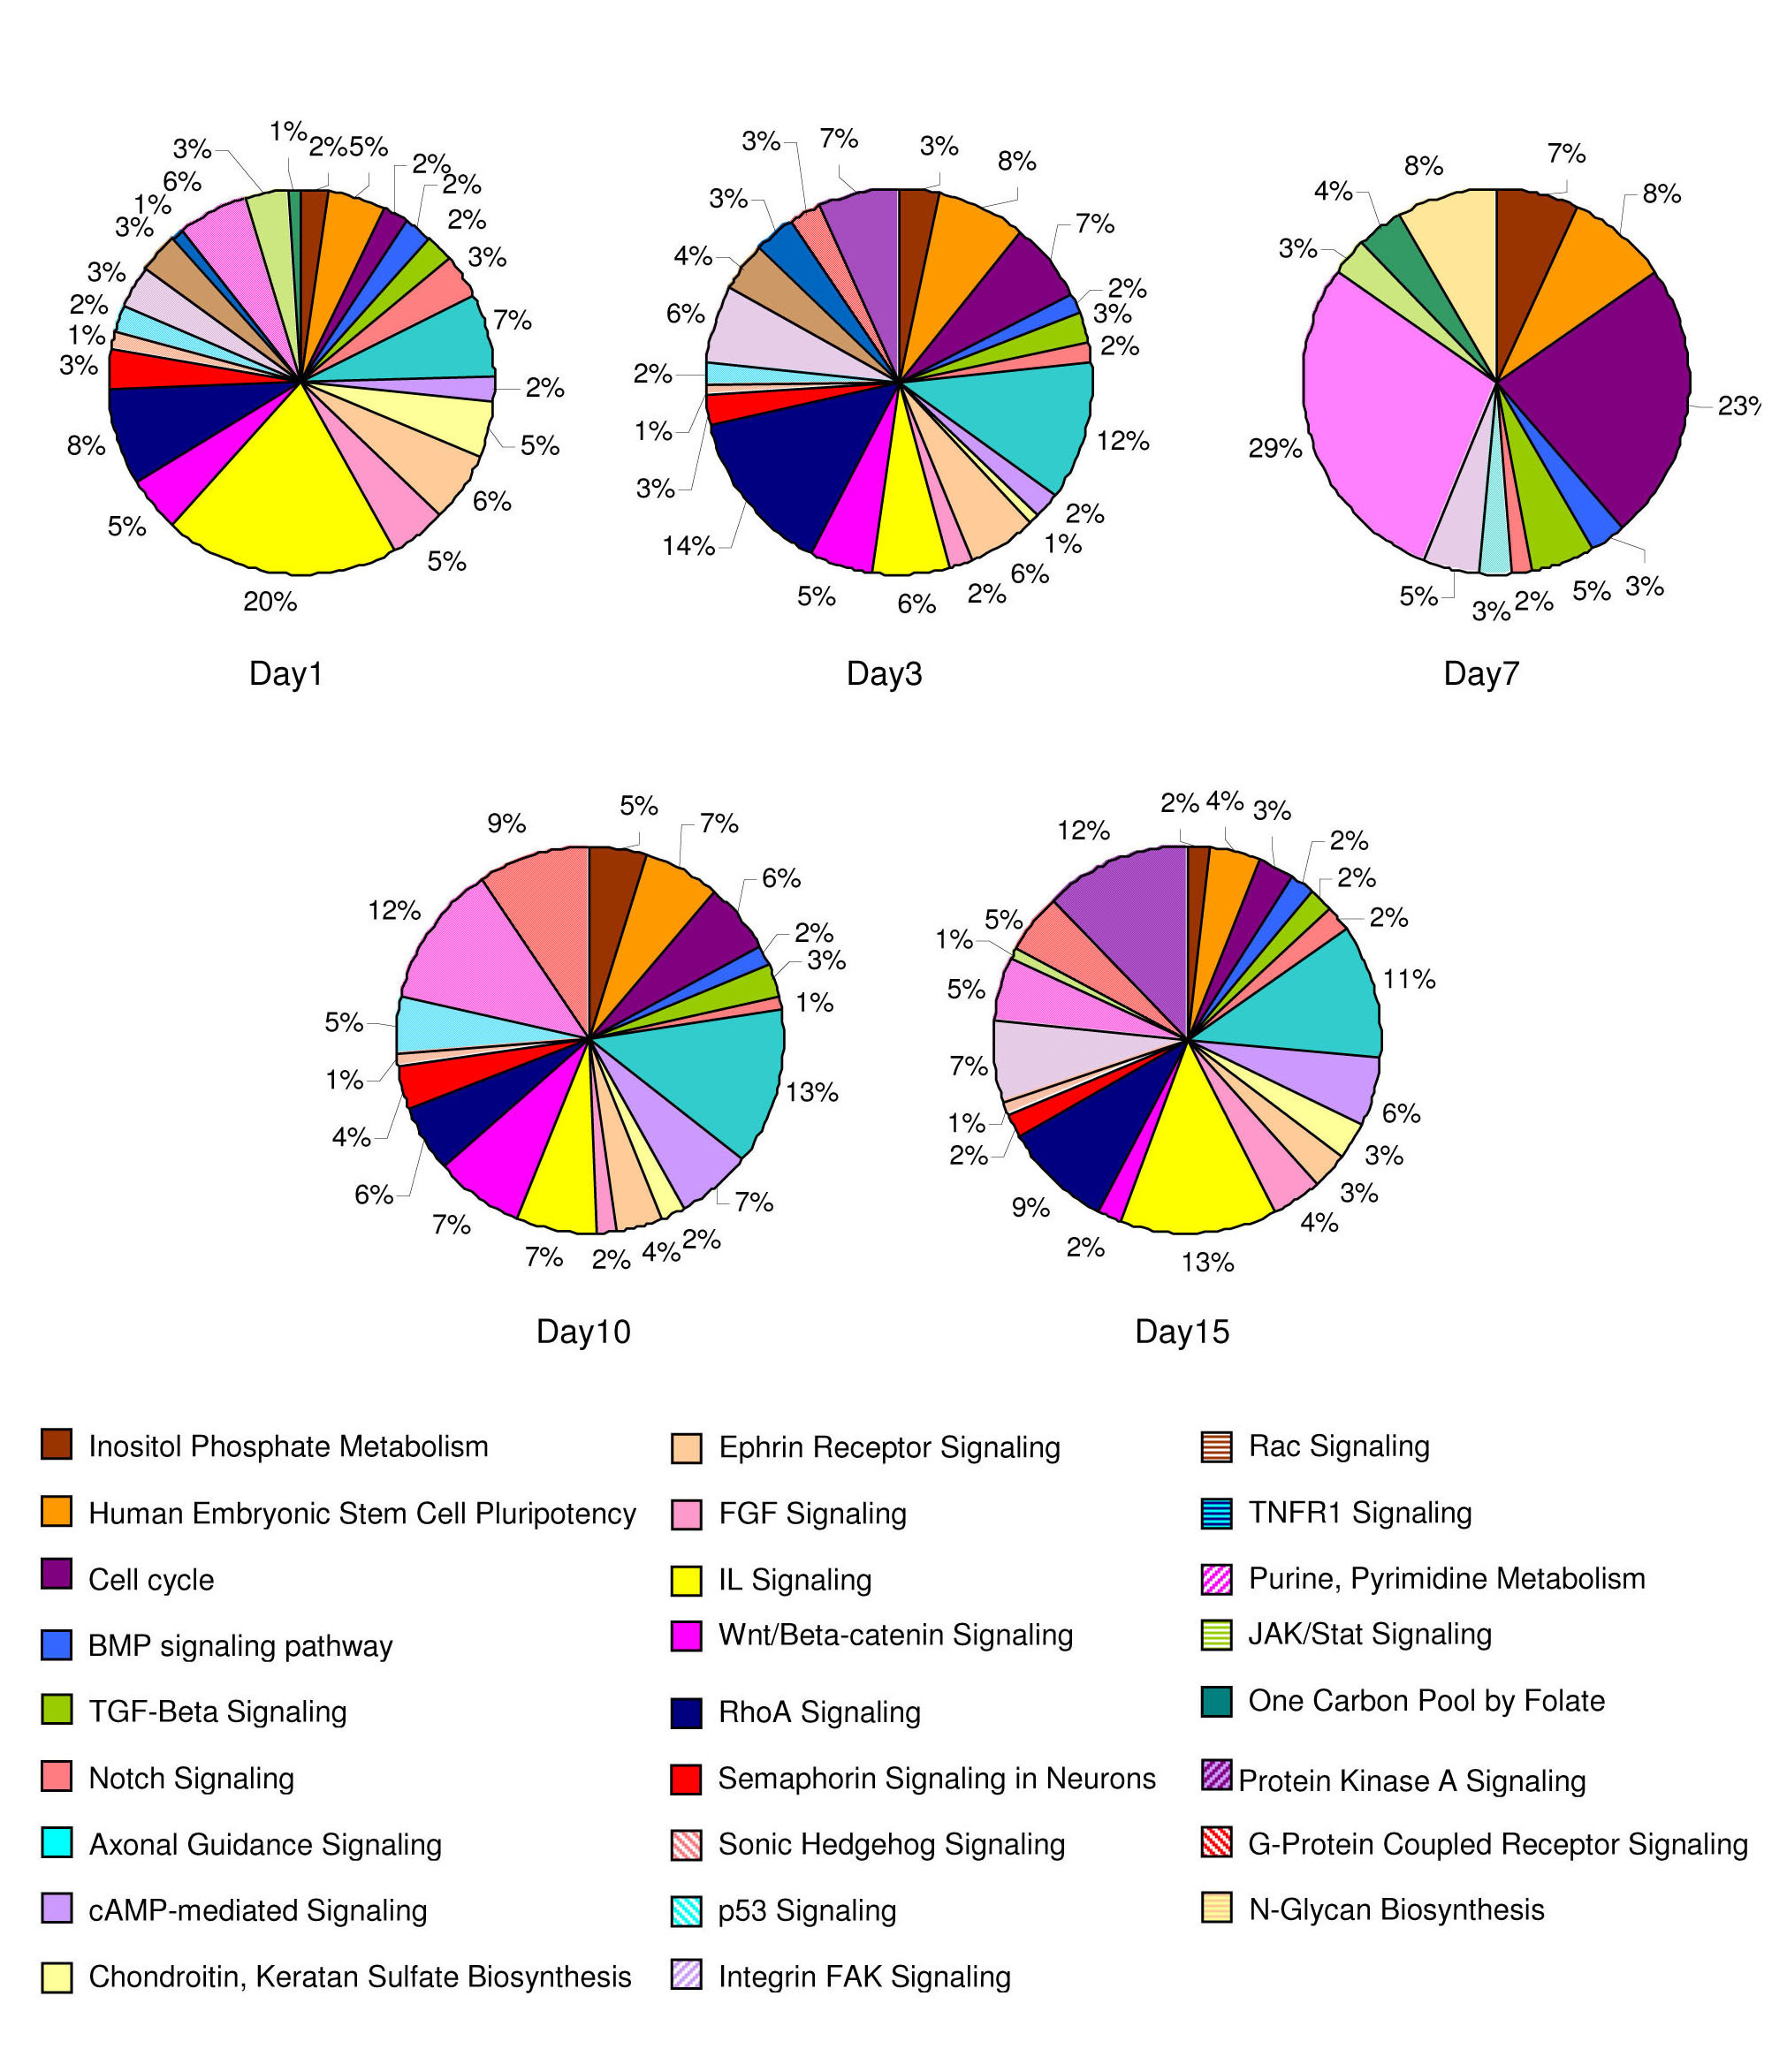
Fig. S3 Pie charts showing the percentage of canonical pathway enriched genes that are differentially expressed at different time points after SCI in zebrafish.
Acknowledgments
This image is the copyrighted work of the attributed author or publisher, and
ZFIN has permission only to display this image to its users.
Additional permissions should be obtained from the applicable author or publisher of the image.
Full text @ PLoS One