IMAGE

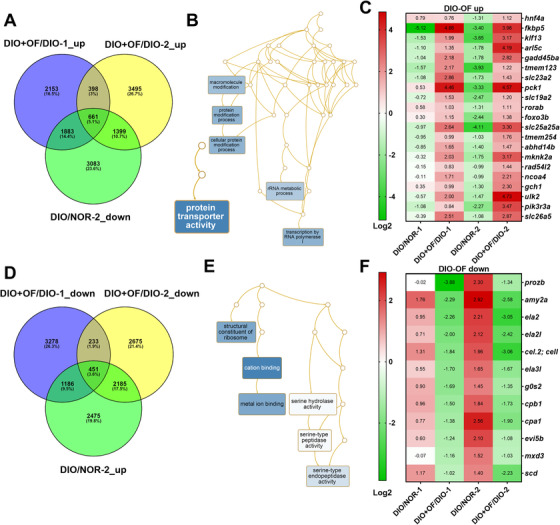
FIGURE 4

ID
ZDB-IMAGE-210103-26
Source
Figures for Wu et al., 2020
Image
Figure Caption

FIGURE 4

Pathways analysis for the differential expressed genes in [HBx,src], and [HBx,src,p53−/+] transgenic zebrafish following oligo‐fucoidan treatment. A, Venn diagram of genes was upregulated in oligo‐fucoidan pretreatment but downregulated by DIO and carcinogens. B, Network analysis of oligo‐fucoidan induced genes. C, The heatmap of top 21 oligo‐fucoidan upregulated genes. D, Venn diagram of genes was downregulated in oligo‐fucoidan pretreatment but up‐regulated by DIO and carcinogens. E, Network analysis of oligo‐fucoidan downregulated genes. F, The heatmap of top 12 oligo‐fucoidan downregulated genes.

Acknowledgments
This image is the copyrighted work of the attributed author or publisher, and ZFIN has permission only to display this image to its users. Additional permissions should be obtained from the applicable author or publisher of the image. Full text @ Clin Transl Med