
Image
|
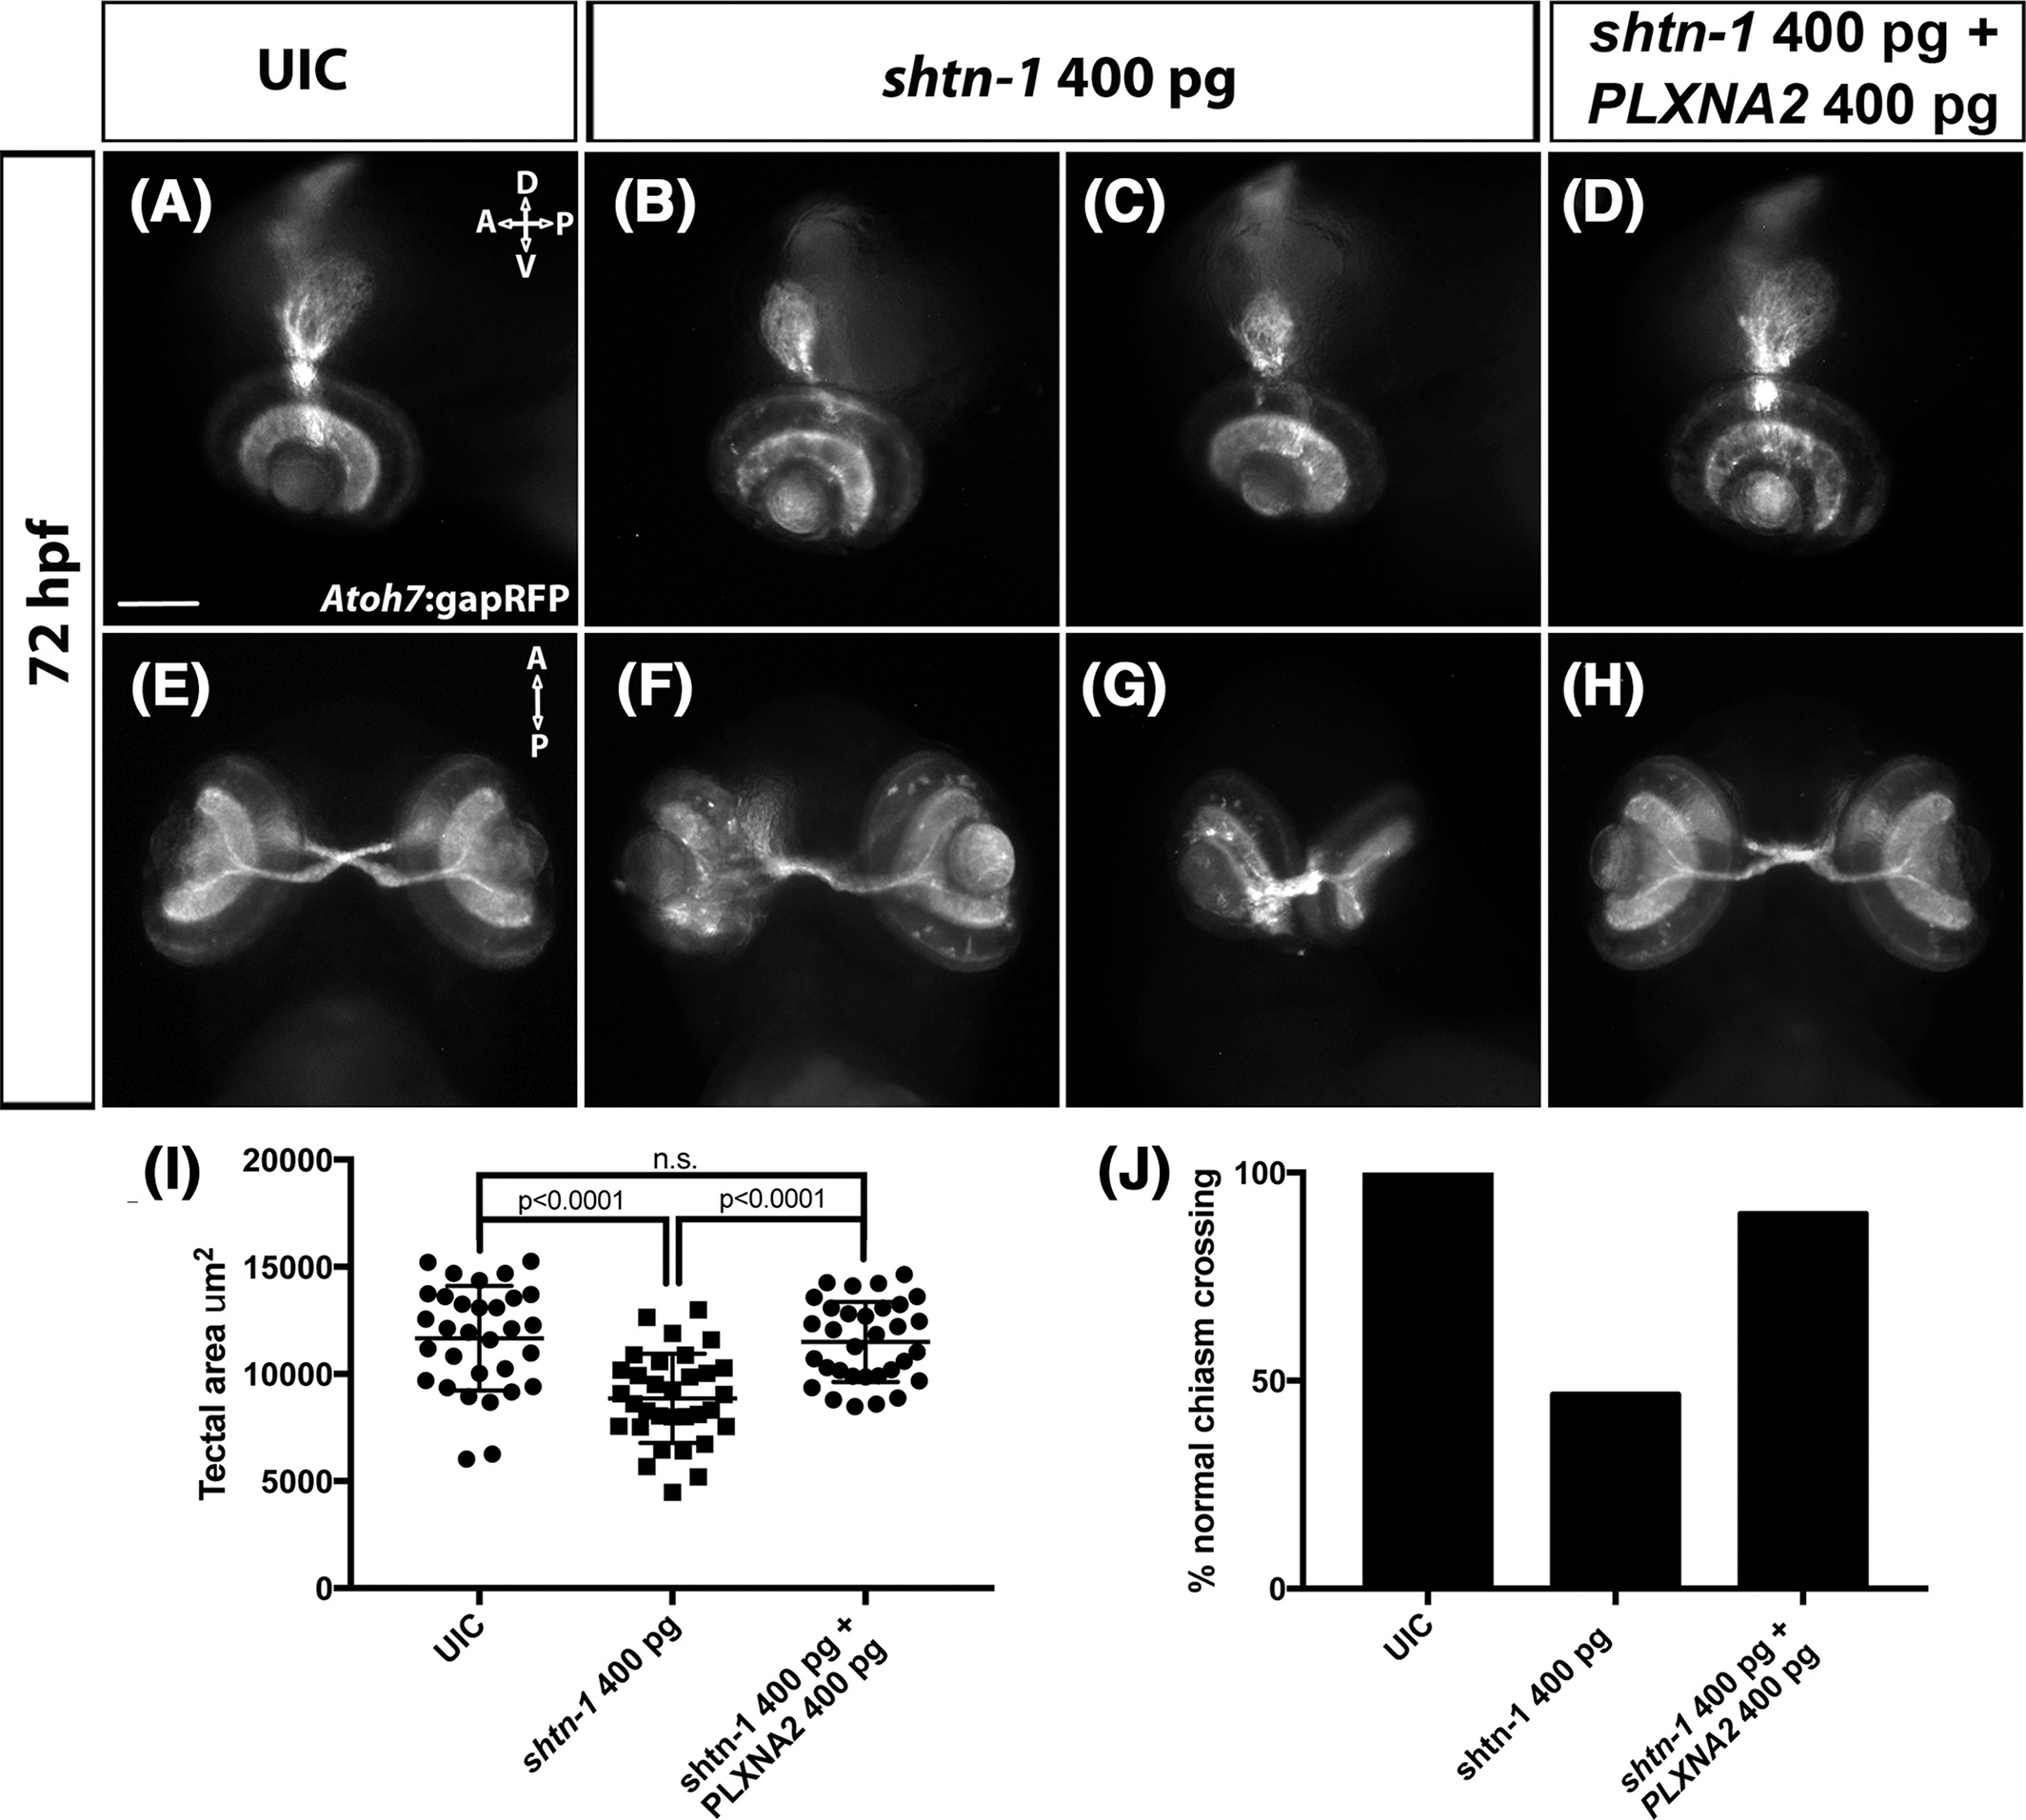
Figure Caption
Fig. 4 Plxna2 regulation of shtn‐1 levels is important for retinal axon crossing. A‐D, Lateral view of Atoh7:gapRFP embryos at 72 hpf. E‐H, Ventral views of optic chiasm. I, Quantification of tectal area, as seen in A‐D. (P‐values were calculated using one‐way ANOVA, Tukey's multiple comparisons posthoc test). J, Table listing quantification of abnormal chiasm projections. Scale bar 100 μm; A, anterior; D, dorsal; P, posterior, UIC, uninjected control; V, ventral
Figure Data
Acknowledgments
This image is the copyrighted work of the attributed author or publisher, and
ZFIN has permission only to display this image to its users.
Additional permissions should be obtained from the applicable author or publisher of the image.
Full text @ Dev. Dyn.