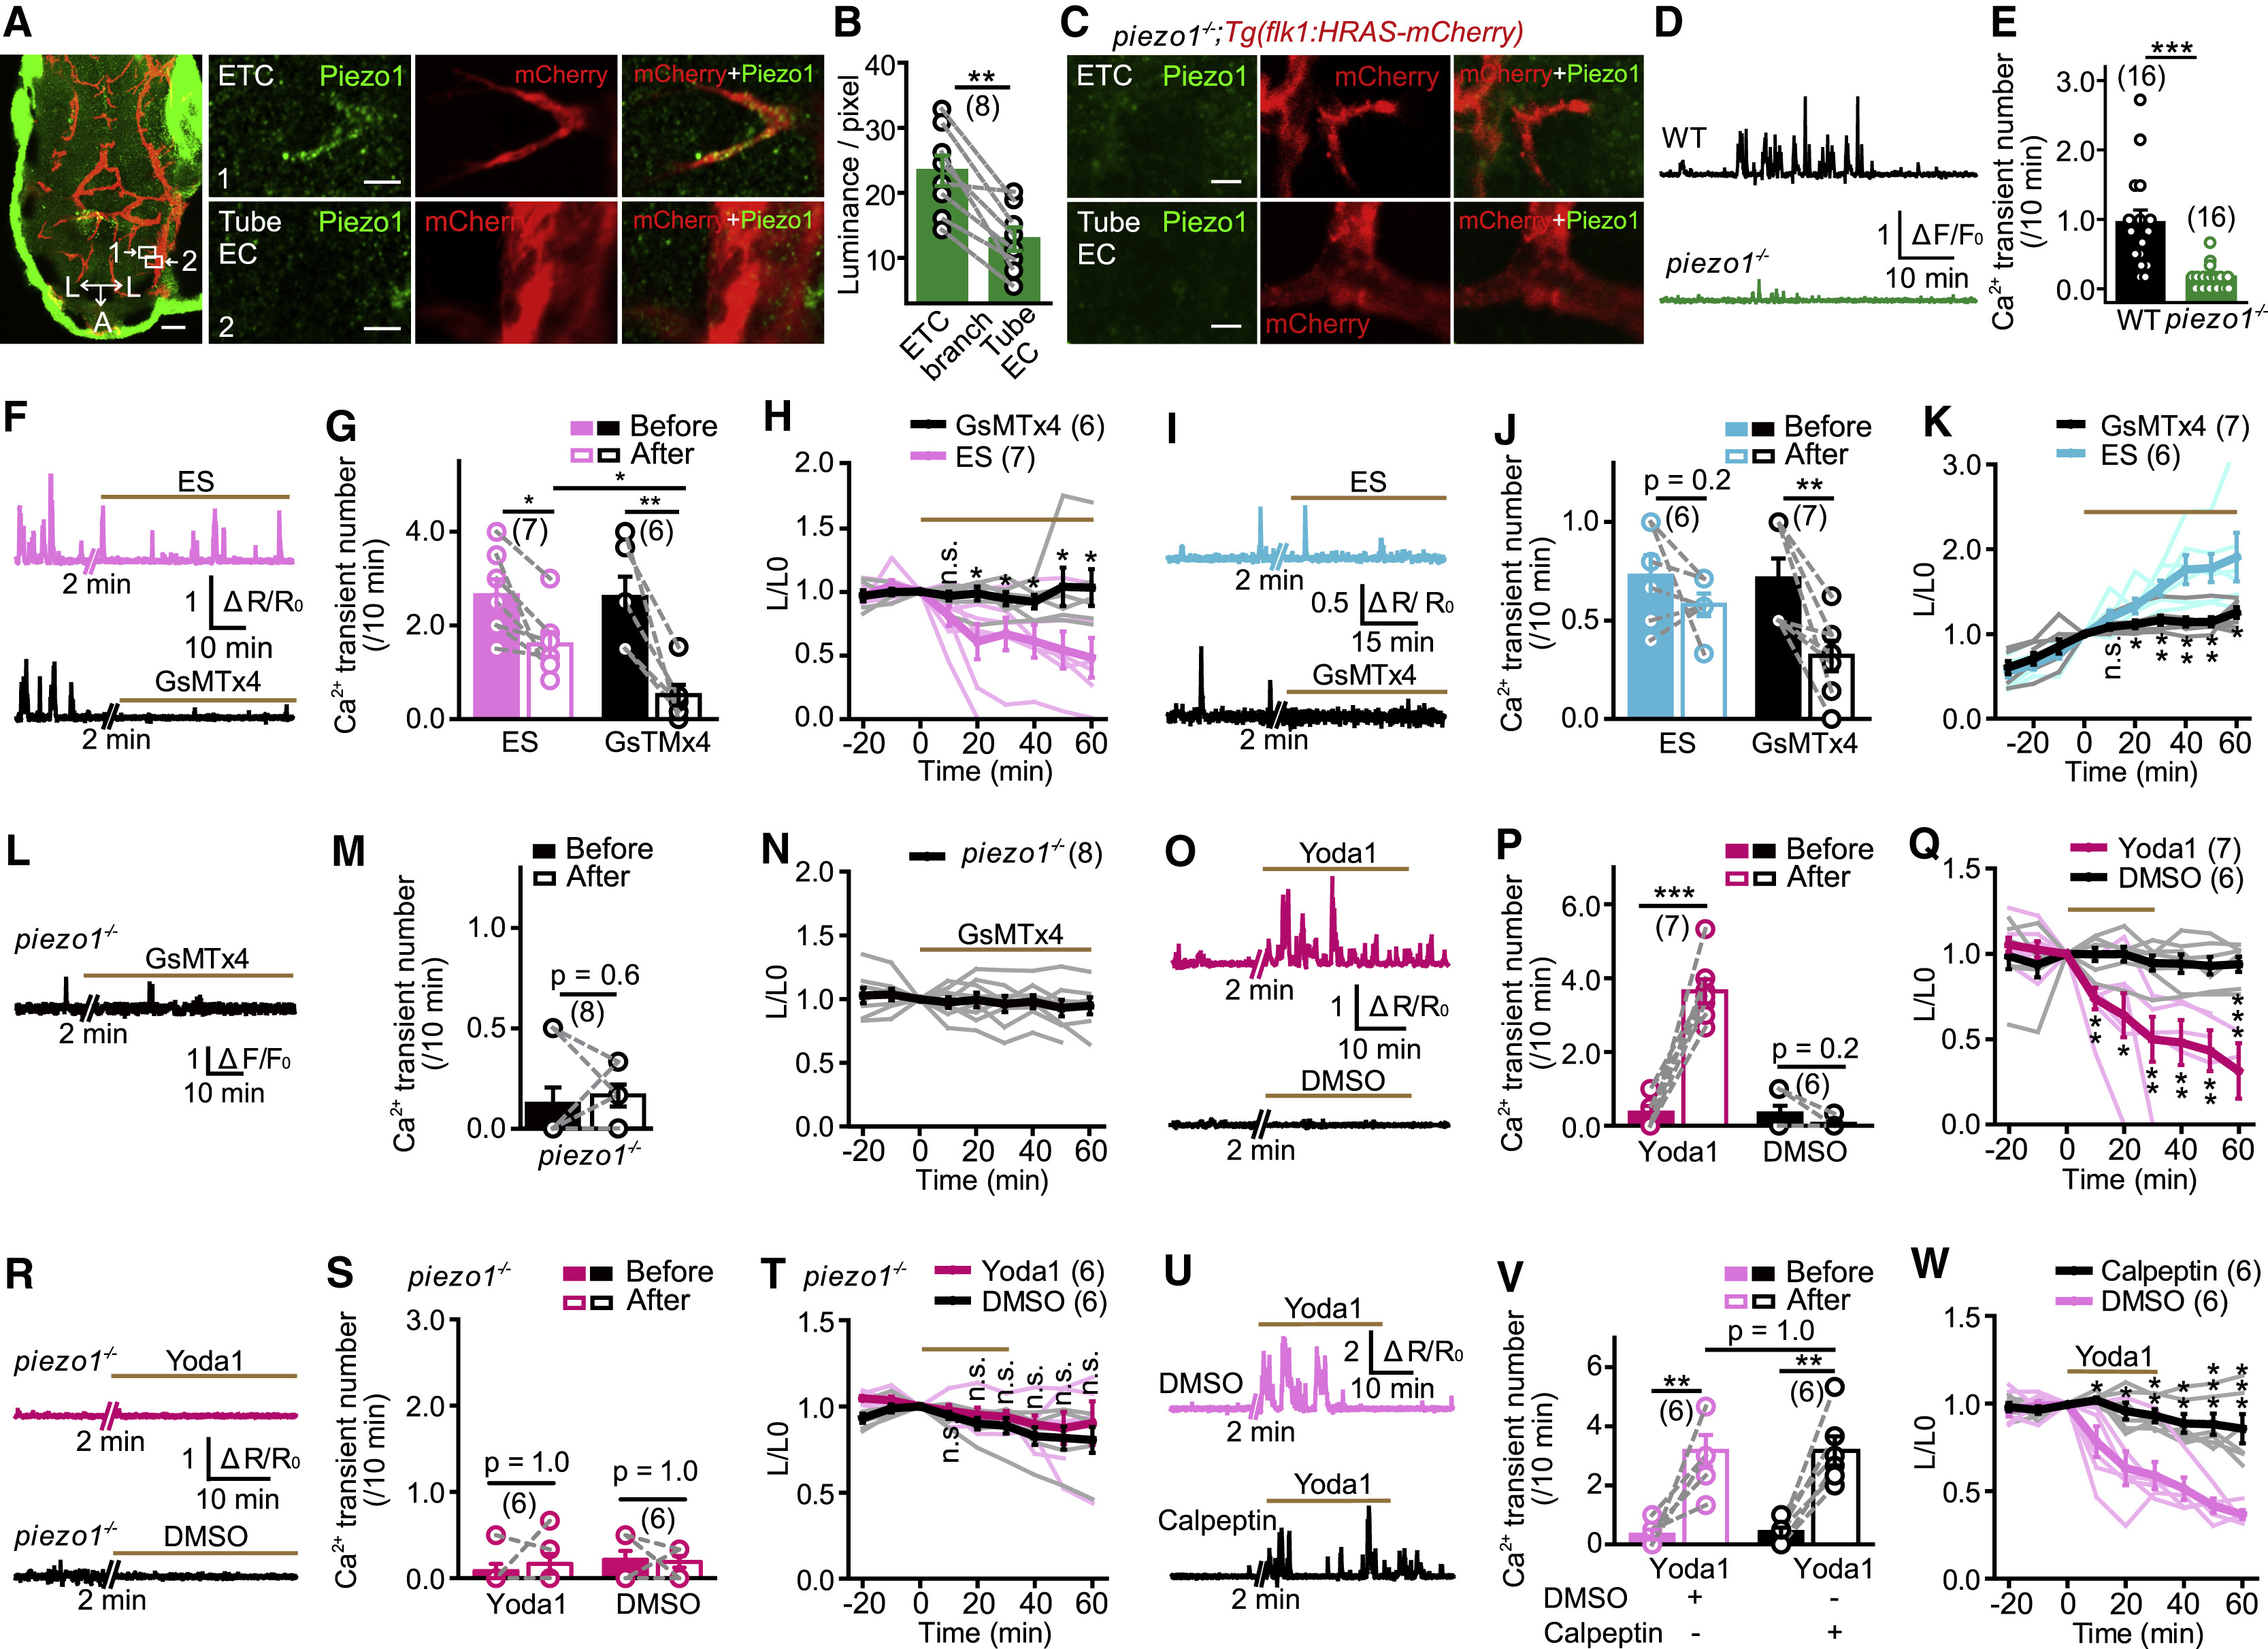
Fig. 4 Piezo1 Is Required for Local Ca2+ Transients and Retraction/Extension of ETC Branches (A) Representative images of Piezo1 immunostaining in the brain of a 3-dpf Tg(kdrl:HRAS-mcherry) larval zebrafish. (Left) Projection image of the brain is shown. (Right) Enlarged images (single optical section) outlined in the left are shown. Tube EC, EC located at a vessel tube. Green signals around the brain (left) are due to non-specific staining of the skin. Scale bars, 40 ?m (left) and 5 ?m (right). (B) Summary of the relative density of Piezo1 signal at ETC branches and nearby Tube EC. The data were from 8 pairs of ETCs and nearby tube ECs in 5 larvae. (C) Representative immunostaining of Piezo1 in a 3-dpf piezo1?/?;Tg(kdrl:HRAS-mcherry) larva. Scale bars, 5 ?m. (D and E) Examples and summary showing local Ca2+ activities of ETC branches in Tg(kdrl:GCaMP5) larvae with WT or piezo1?/? background. The data were from 16 ETCs in 9 WT siblings and 16 ETCs in 7 piezo1?/? larvae. (F?H) Effects of GsMTx4-mediated Piezo1 blockade on relatively high frequency local Ca2+ activities and morphological changes of ETC branches. (I?K) Effects of GsMTx4-mediated Piezo1 blockade on relatively low frequency local Ca2+ activities and morphological changes of ETC branches. (L?N) Effect of GsMTx4 application on ETC branches in piezo1?/? larvae. (O?Q) Effects of Yoda1-induced Piezo1 activation on local Ca2+ activities and morphological dynamics of ETC branches. (R?T) Effect of Yoda1 application on ETC branches in piezo1?/? larvae. (U?W) Effects of calpeptin-mediated calpain blockade on Yoda1-induced Ca2+ activities and morphological changes of ETC branches. ?p < 0.05; ??p < 0.01; ???p < 0.001 (paired two-tailed Student?s t test for B and M and intra-group comparison in G, J, P, and V; unpaired two-tailed Student?s t test for H, K, Q, T, and W and inter-group comparison in G and V; two-tailed Wilcoxon signed rank test for intra-group data comparison in S and two-tailed Mann-Whitney test for E). Mean ± SEM. See also Figure S5.
Image
Figure Caption
Figure Data
Acknowledgments
This image is the copyrighted work of the attributed author or publisher, and
ZFIN has permission only to display this image to its users.
Additional permissions should be obtained from the applicable author or publisher of the image.
Full text @ Neuron

