IMAGE

Fig. 5.

ID
ZDB-IMAGE-201024-5
Source
Figures for Hughes et al., 2020
Image
Figure Caption

Fig. 5.

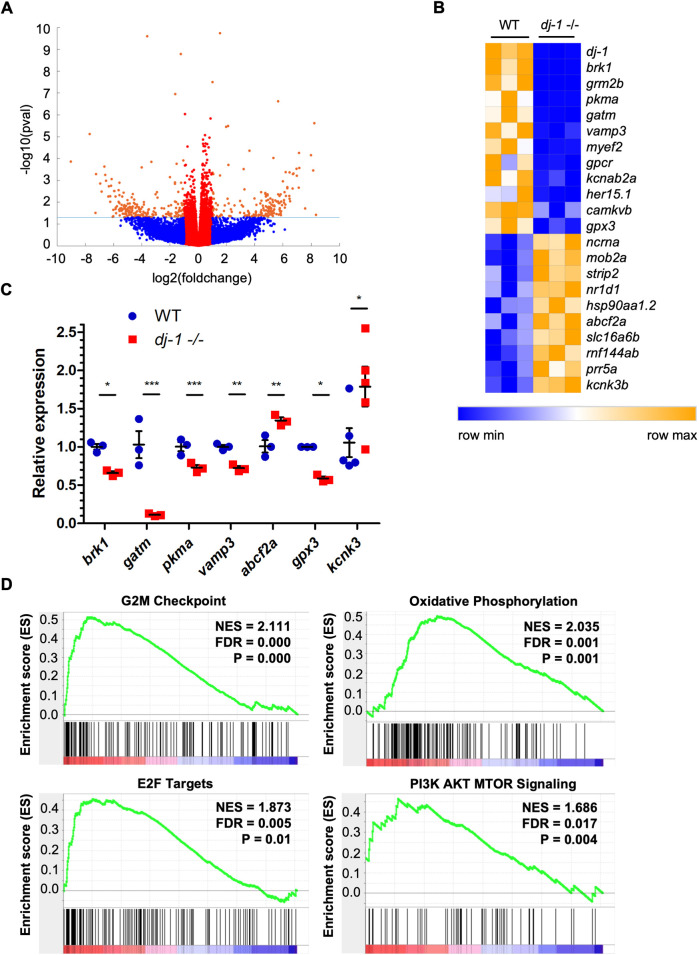
Differential gene expression in thedj-1−/− mutant brain. (A) A volcano plot representing the global changes in gene expression observed by RNA-seq analysis, comparing RNA from the brains of dj-1−/− mutants (n=3, biological replicates) and their wild-type siblings (n=3) at 16 wpf. The fold change (log2) of each transcript was plotted against the P-value (−log10). Transcripts in red are down/upregulated less than 2-fold. Transcripts in orange that appear above the dotted line are differentially expressed with a P-value of <0.05 and down/upregulated more than 2-fold. Transcripts in blue have a P-value of ≥0.05. (B) A heatmap showing select genes differentially expressed with an FDR q-value of <0.05. Relative expression is represented on a colour scale from blue (low) to orange (high). (C) qRT-PCR analysis validating the results seen in the RNA-seq using RNA extracted from the brains of dj-1−/− and wild-type siblings at 16 wpf (n=3 for all but n=5 for kcnk analysis, biological replicates). Student's t-tests (two-tailed, unpaired) were used to compare the dCt values for dj-1−/− and wild-type samples. Data are mean±s.e.m., *P<0.05, **P<0.01, ***P<0.001. (D) GSEA enrichment plots for Hallmark gene sets: G2M checkpoint, oxidative phosphorylation, E2F transcription factors and PI3K/AKT/mTOR signalling. FDR, false discovery rate-adjusted P-value; NES, normalised enrichment score; P, nominal P-value. Data have been deposited in GEO, accession number GSE135271.

Acknowledgments
This image is the copyrighted work of the attributed author or publisher, and ZFIN has permission only to display this image to its users. Additional permissions should be obtained from the applicable author or publisher of the image. Full text @ Dis. Model. Mech.