IMAGE

Fig. EV2

ID
ZDB-IMAGE-201012-112
Source
Figures for Pini et al., 2020
Image
Figure Caption

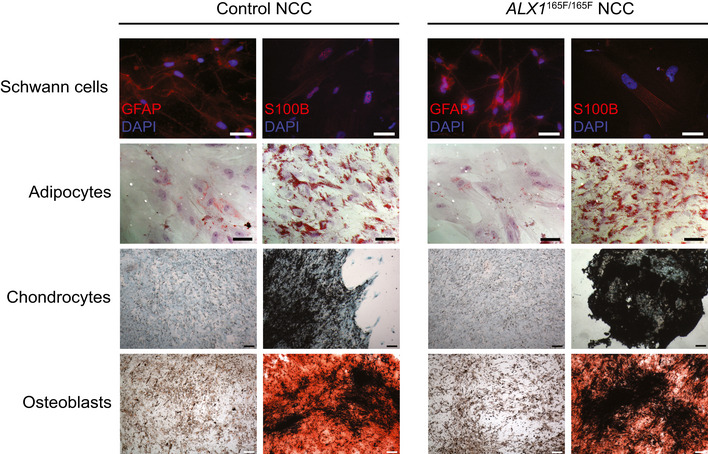
Fig. EV2 Characterization of <styled-content toggle='no' style='fixed-case'>NCC</styled-content>

Multilineage differentiation experiments revealed that both control and subject‐derived NCC are able to differentiate into Schwann cells, shown by the GFAP and S100B‐positive immunofluorescence staining; adipocytes, demonstrated by the Oil Red O. positive lipidic droplets; osteoblasts, shown by Alizarin Red S. positive mineralized nodules and chondrocytes, assessed by Alcian Blue‐positive cartilaginous matrix. Scale bar is 200 μm for images of Schwann cells and adipocytes, and 400 μm for images of chondrocytes and osteoblasts.

Acknowledgments
This image is the copyrighted work of the attributed author or publisher, and ZFIN has permission only to display this image to its users. Additional permissions should be obtained from the applicable author or publisher of the image. Full text @ EMBO Mol. Med.