IMAGE

Fig. 5.

ID
ZDB-IMAGE-200910-22
Source
Figures for Oppel et al., 2020
Image
Figure Caption

Fig. 5.

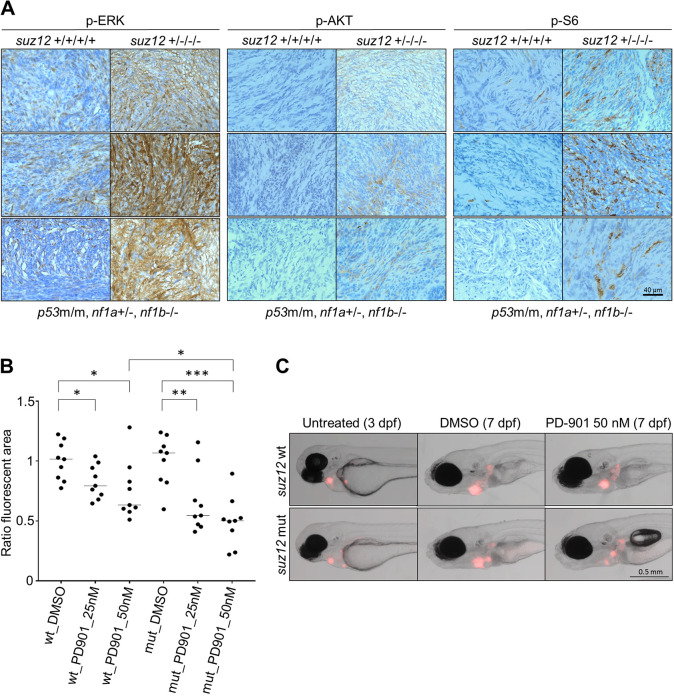
Evaluation and inhibition of the Ras signaling pathway in suz12-mutant and suz12-wild-type MPNSTs. (A) Immunohistochemistry analysis of signaling in three individual suz12-mutant (suz12+/−/−/−) and suz12-wild-type (suz12+/+/+/+) MPNSTs (n=3) each stained for phosphorylation of ERK, AKT, and S6 (p-ERK, p-AKT, and p-S6), indicating activation of Ras signaling. (B) The suz12a+/−, suz12b−/− (mut) or suz12-wild-type control MPNST (wt) tumor cell growth in the pericardial cavity of implanted embryos. These embryos were treated with DMSO vehicle control or PD-3025901 (PD901; 25 or 50 nM) (n=9 fish per treatment, doses based on the maximum tolerated dose of the individual drug). The fluorescent tumor area was determined for each embryo at 3 dpf (pre-treatment) and 7 dpf (post-treatment), and was reported as the normalized ratio of the red fluorescent area at 3  dpf versus 7 dpf in individual embryos. Individual values with medians (black bars) are shown. *P<0.05, **P=0.0064, ***P<0.0001 (Student's t-test). (C) Representative fish images at 3 dpf and 7 dpf after DMSO control or 50 nM PD0325901 treatment.

Acknowledgments
This image is the copyrighted work of the attributed author or publisher, and ZFIN has permission only to display this image to its users. Additional permissions should be obtained from the applicable author or publisher of the image. Full text @ Dis. Model. Mech.