
|
Figure 3
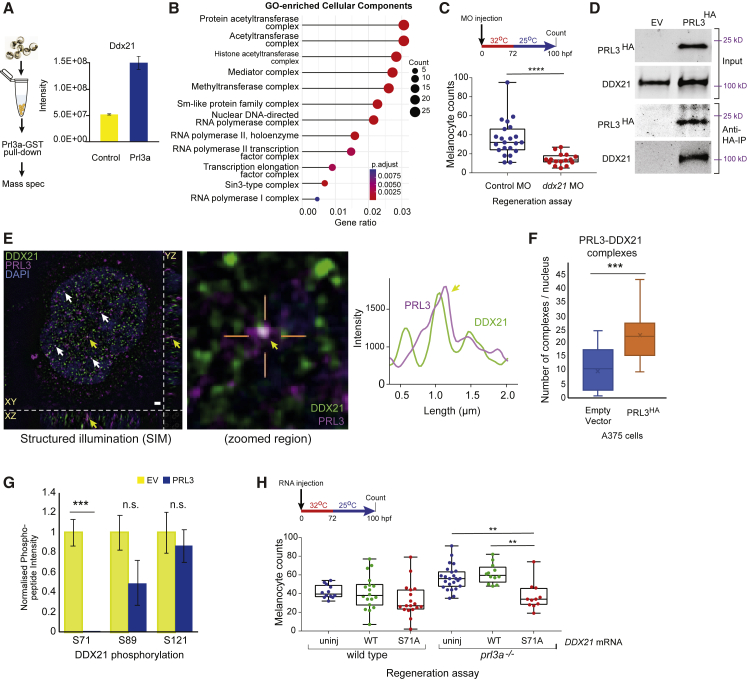
Prl3a Interacts with Ddx21 in Zebrafish and Melanoma Cell Nuclei
(A) Experimental overview and intensity quantification of Ddx21 peptides from Prl3a-GST pull-downs. Bars and error bars are mean ± SEM. See also
(B) Cellular component GO-enrichment analysis of Prl3a-interacting proteins identified by co-immunoprecipitation and mass-spectrometry (adjusted p values: Benjamini-Hochberg test).
(C) Quantification of melanocytes in a
(D) Co-immunoprecipitation of human HA-tagged PRL3 protein from A375 cells: empty vector (EV) and PRL3-expressing stable transfected cells.
(E) Structured illumination microscopy (SIM) of endogenous PRL3 (magenta) and DDX21 (green) in C092 melanoma cells. Scale bar, 1 μm. Co-localization indicated (arrows); zoomed image shows PRL3-DDX21 co-localization with line scan, and intensity plot profile of line scan showing signal overlap (yellow arrow). DAPI: blue. See also
(F) Quantification of PRL3-DDX21 complexes per nucleus identified by SIM in A375 melanoma cells expressing empty vector or HA-tagged PRL3 (∗∗∗p < 0.001, error bars: x indicates the mean; Student's t test). See also
(G) Mass spectrometry of DDX21 phosphorylation sites in EV control cells (n = 5 samples) and cells expressing PRL3 (n = 7 samples) (∗∗∗p < 0.001; n.s., not significant; Bars and error bars are mean ± SEM; Student's t test). See also
(H) Quantification of regenerating melanocytes in wild-type or
Reprinted from Developmental Cell, 54(3), Johansson, J.A., Marie, K.L., Lu, Y., Brombin, A., Santoriello, C., Zeng, Z., Zich, J., Gautier, P., von Kriegsheim, A., Brunsdon, H., Wheeler, A.P., Dreger, M., Houston, D.R., Dooley, C.M., Sims, A.H., Busch-Nentwich, E.M., Zon, L.I., Illingworth, R.S., Patton, E.E., PRL3-DDX21 Transcriptional Control of Endolysosomal Genes Restricts Melanocyte Stem Cell Differentiation, 317-332.e9, Copyright (2020) with permission from Elsevier. Full text @ Dev. Cell