
Image
|
Figure Caption
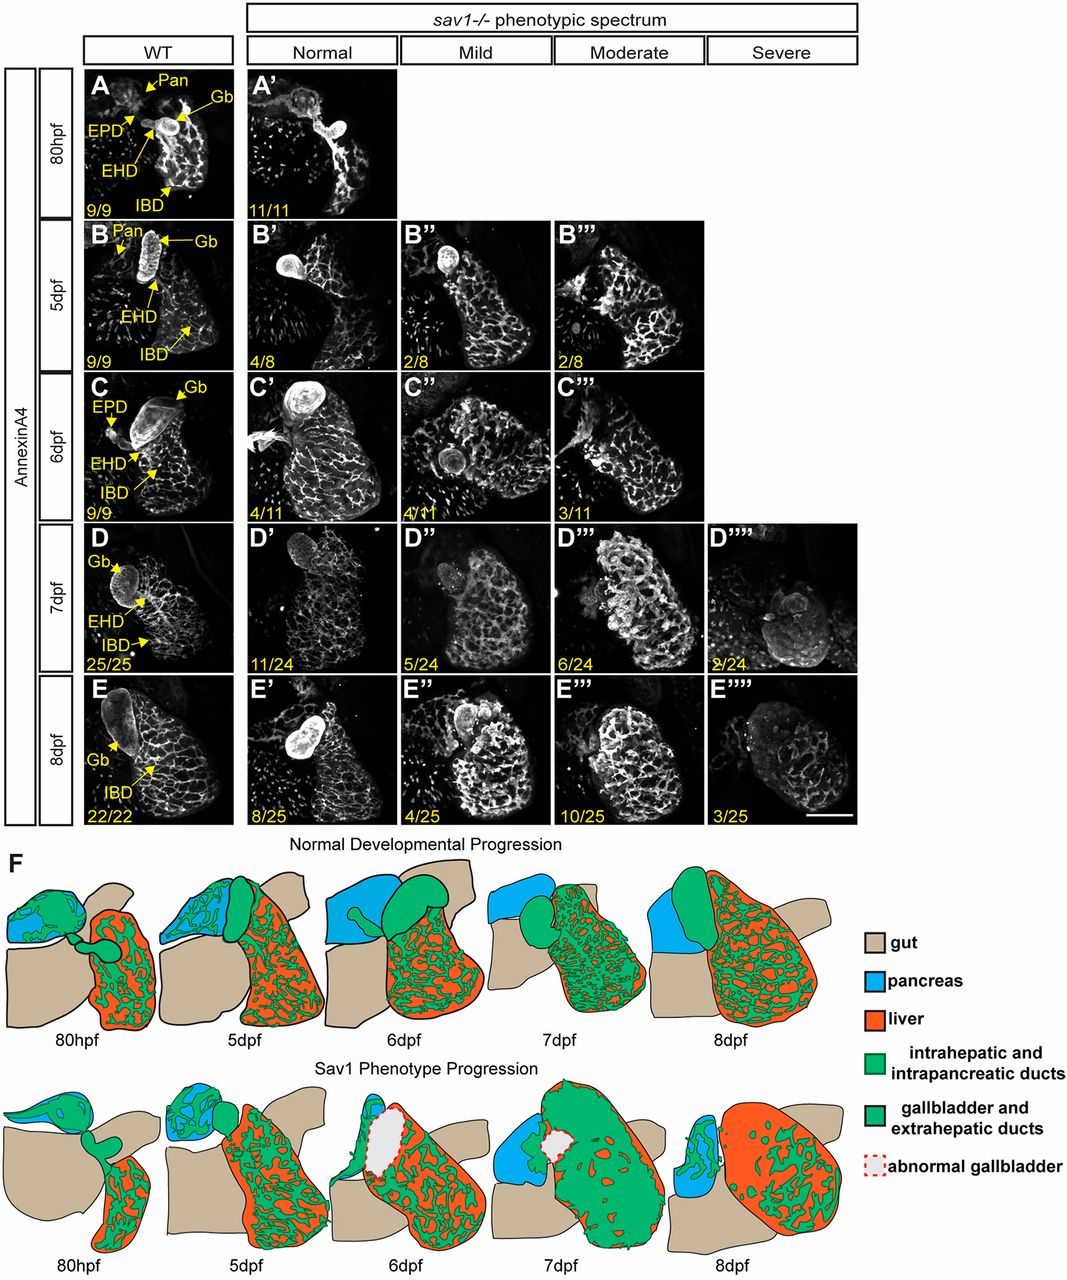
Fig. 2 sav1 mutants display a wide spectrum of biliary morphology representative of phenotype progression. (A-E″″) Whole-mount annexin A4 staining of liver and gallbladder from 80 hpf to 8 dpf. Pan, pancreas; Gb, gallbladder; EHD, extrahepatic duct; EPD, extrapancreatic duct; IBD, intrahepatic bile duct. Numbers indicate the ratio of fish that displayed the phenotype/total fish analyzed. (F) Cartoon depictions of each time-point.
Figure Data
Acknowledgments
This image is the copyrighted work of the attributed author or publisher, and
ZFIN has permission only to display this image to its users.
Additional permissions should be obtained from the applicable author or publisher of the image.
Full text @ Development