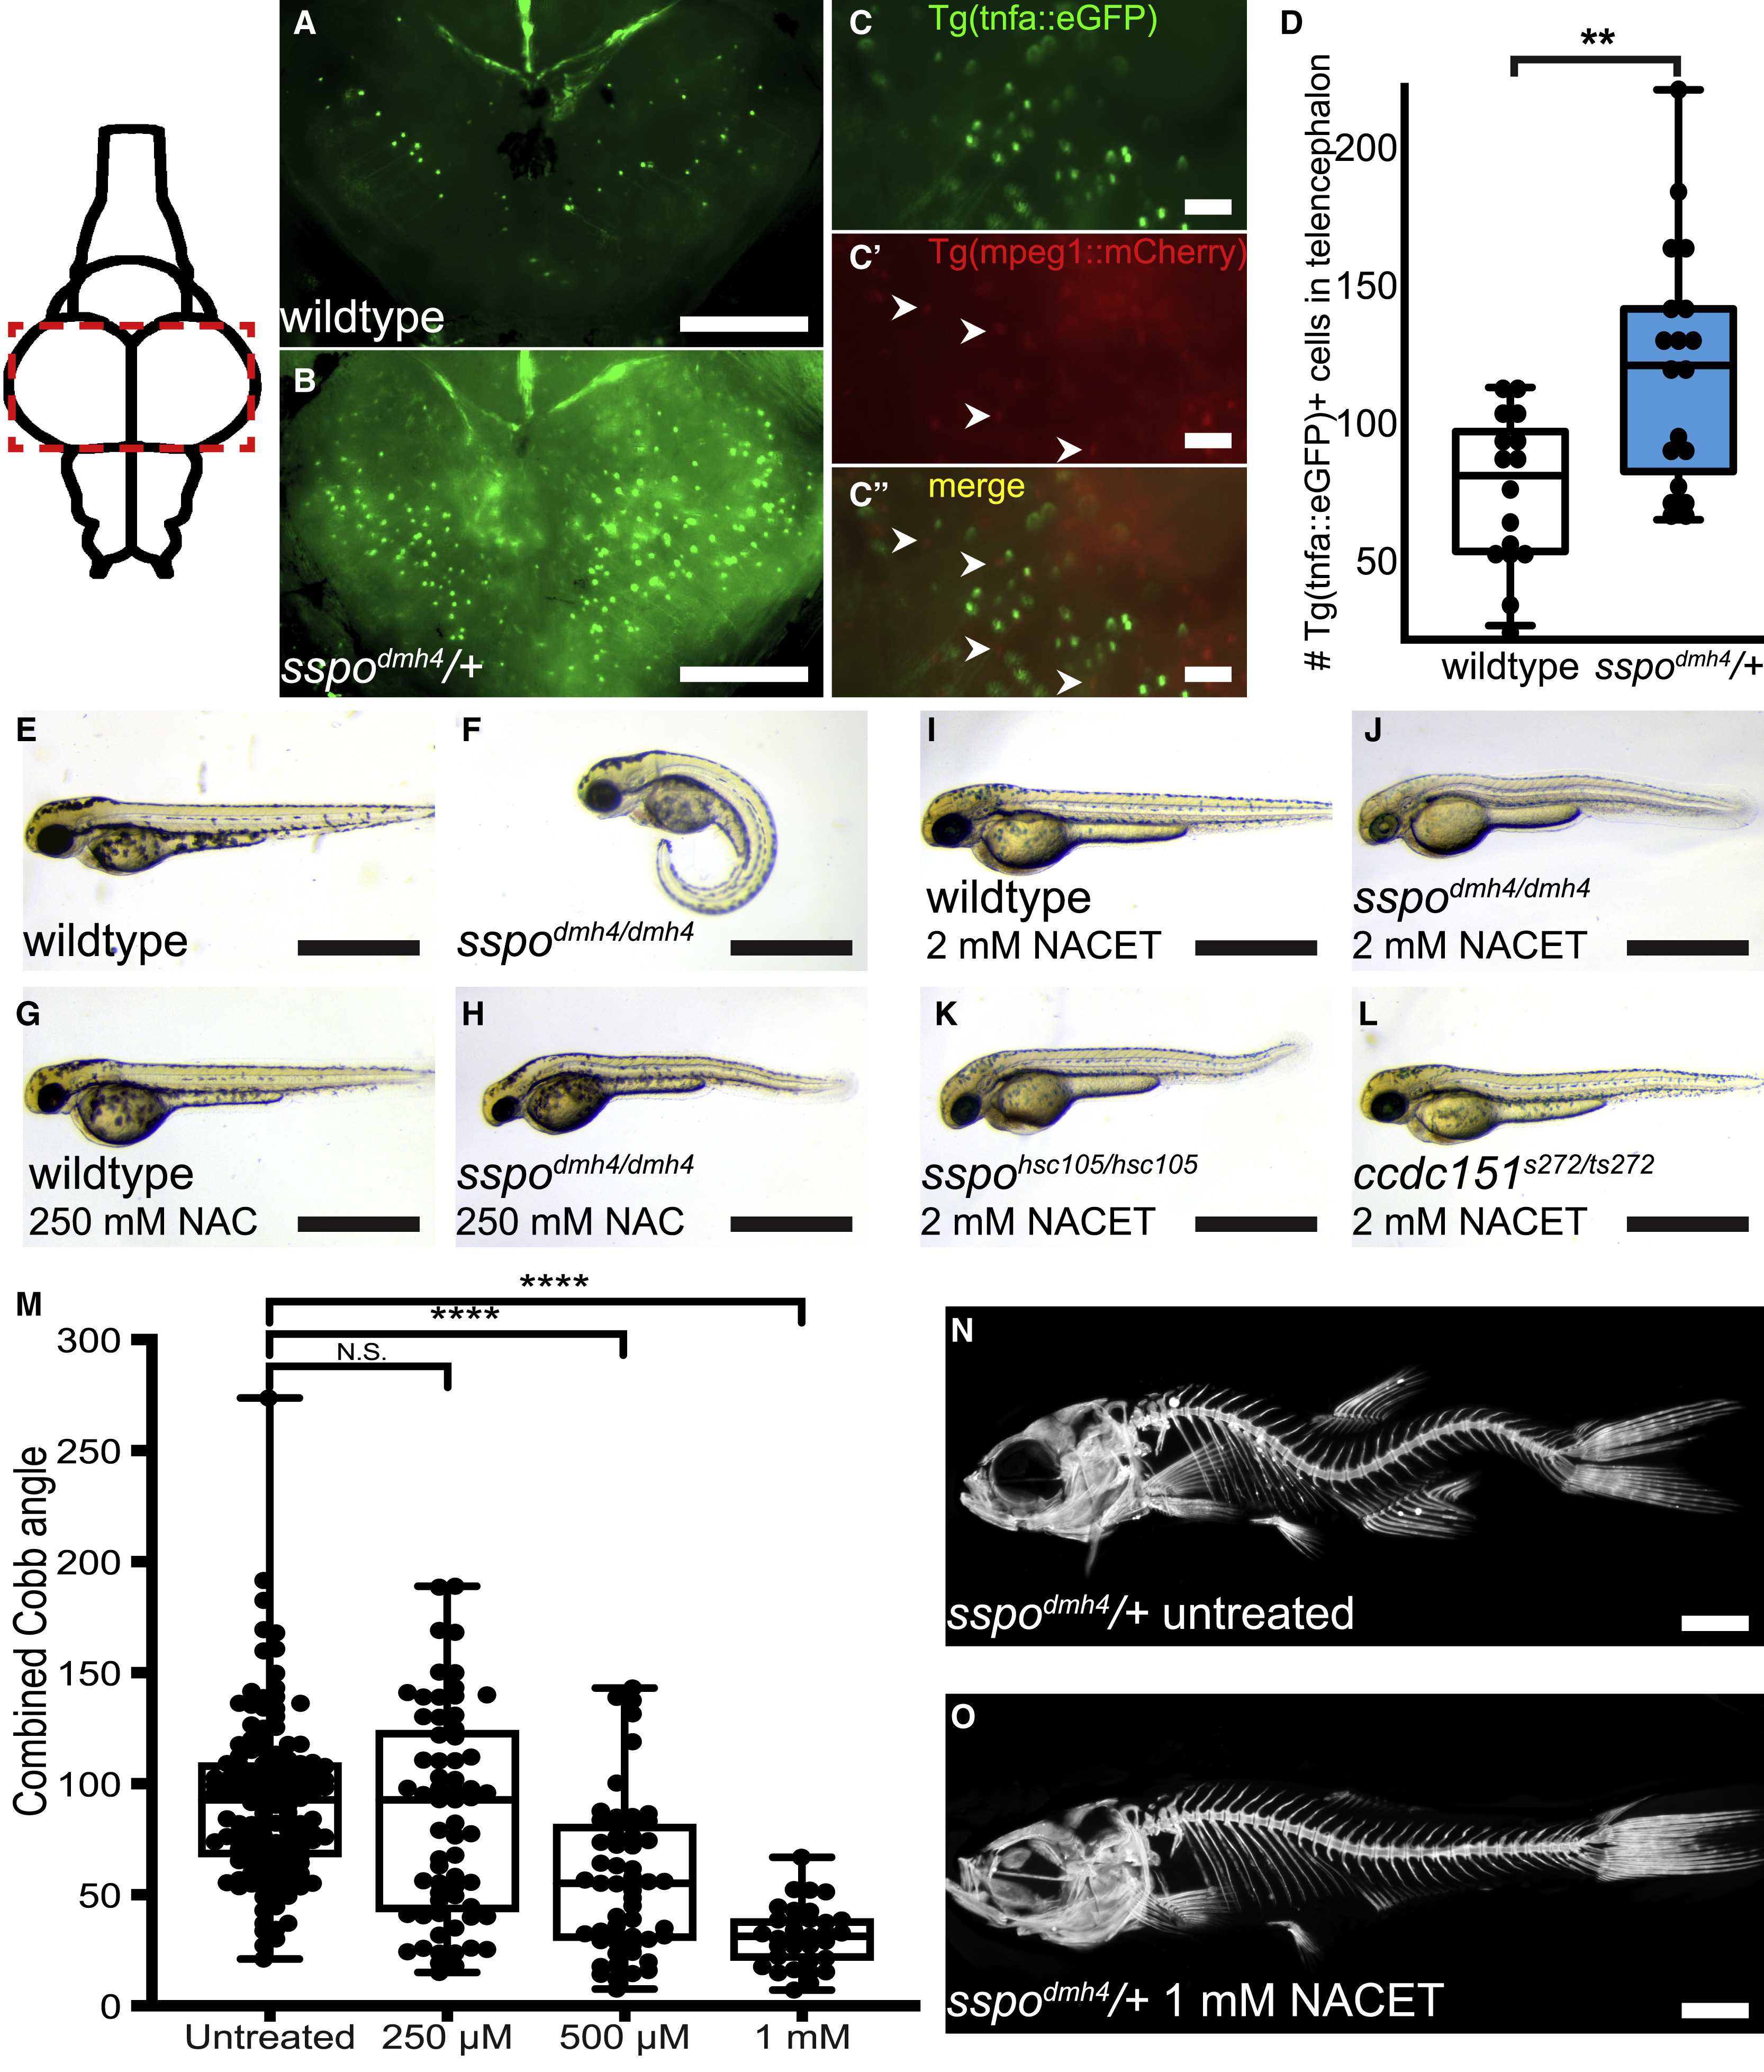
Fig. 4 Chemical Suppression of CTD Phenotype Identifies NACET as a Potent Inhibitor of Severe Spinal Curve Progression (A?D) Evidence of neuroinflammation in scoliotic sspodmh4/+ fish. (A?C) Dorsal whole-mount images of brains dissected from juvenile (21-dpf) wild-type (A) and scoliotic sspodmh4/+ (B and C) zebrafish expressing the TgBAC(tnfa:eGFP) reporter, revealing an increase of TgBAC(tnfa:eGFP) activity in the telencephalon of sspodmh4/+ animals. TgBAC(tnfa:eGFP) expression does not co-localize with Tg(mpeg1:mCherry)-positive macrophages (arrows in C). Images were acquired using a Zeiss V16 Axio Zoom compound fluorescent microscope. Rostral is down. Scale bars represent 200 ?m (A and B) and 50 ?m (C). (D) Quantification of TgBAC(tnfa:eGFP)+ cells in the telencephalon of 21-dpf animals reveals a significant increase in sspodmh4/+ fish (??p = 0.0069). (E?L) Lateral photos of 53-hpf zebrafish embryos demonstrating representative axial morphogenesis phenotypes. Wild-type (E) embryos exhibit a straight body axis. sspodmh4/dmh4 (F) embryos demonstrate characteristic curly tail down (CTD) phenotype. Treatment of sspodmh4/dmh4 mutants at 27 hpf with 250 mM NAC in 1% DMSO (H) can suppress CTD defects. Similarly, treatment with 2 mM NACET in 1% DMSO can suppress ventral tail curvatures in sspodmh4/dmh4 (J), sspohsc105/hsc105 (K), and ccdc151ts272/ts272 (L) mutant embryos. In contrast, treatment of wild-type embryos with 250 mM NAC (G) or 2 mM NACET (I) in 1% DMSO does not affect axis morphogenesis. Scale bars represent 1 mm. (M?O) NACET treatment of juvenile sspodmh4/+ zebrafish can suppress severe spinal curve progression. (M) Box and whisker plot for quantified combined Cobb angles measured in untreated control sspodmh4/+ fish (n = 138) and sspodmh4/+ fish treated with 250 ?M (n = 65), 500 ?M (n = 55), and 1 mM (n = 33) of NACET. A significant reduction in curve severity was observed for fish treated with both 500 ?M and 1 mM NACET concentrations (????p < 0.0001; two-tailed t test). (N and O) Representative images of Alizarin Red stained untreated (N) and 1 mM NACET-treated (O) sspodmh4/+ fish are shown. Scale bars represent 1 mm. See also Figure S4 and Tables S1 and S2.
Image
Figure Caption
Figure Data
Acknowledgments
This image is the copyrighted work of the attributed author or publisher, and
ZFIN has permission only to display this image to its users.
Additional permissions should be obtained from the applicable author or publisher of the image.
Full text @ Curr. Biol.

