IMAGE

Fig 7

ID
ZDB-IMAGE-200724-16
Source
Figures for Jiang et al., 2020
Image
Figure Caption

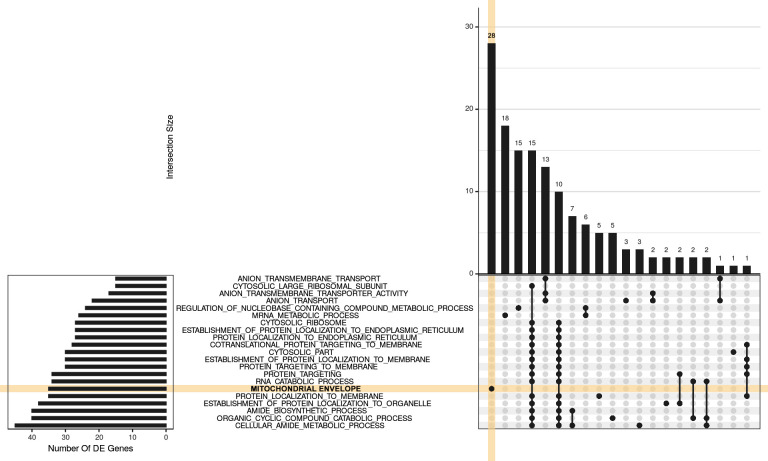
Fig 7 UpSet plot indicating distribution of DE genes within larger significant terms from the GO gene sets.

For this visualization, GO terms were restricted to those with 15 or more DE genes, where this represented more than 5% of the gene set, along with an FDR < 0.02 and more than 3 steps back to the ontology root. The 20 largest GO terms satisfying these criteria are shown with the plot being truncated at the right hand side for simplicity. A group of 28 genes is uniquely attributed to the GO MITOCHONDRIAL ENVELOPE (orange shading), with a further 18 being relatively unique to the GO MRNA METABOLIC PROCESS. The next grouping of 15 genes is unique to GO REGULATION OF NUCLEOBASE-CONTAINING COMPOUND METABOLIC PROCESS followed by 25 genes, spread across two clusters of terms which largely represent GO RIBOSOMAL ACTIVITY. In between these are 13 genes uniquely associated with the GO ANION TRANSPORT.

Acknowledgments
This image is the copyrighted work of the attributed author or publisher, and ZFIN has permission only to display this image to its users. Additional permissions should be obtained from the applicable author or publisher of the image. Full text @ PLoS One